
Why Math is Useful
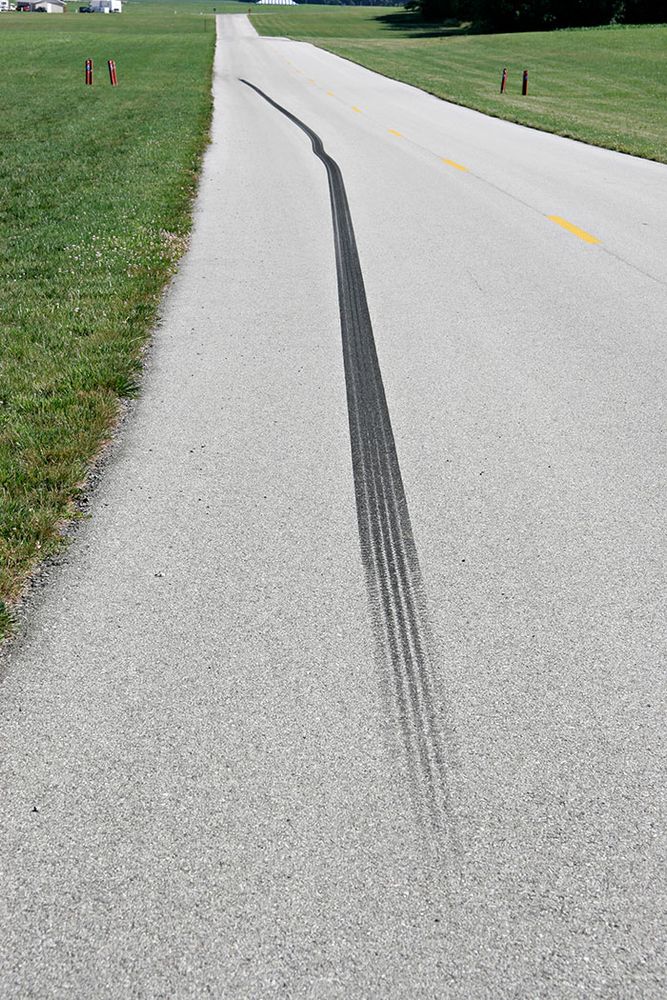
Have you ever driven, or been inside, a vehicle travelling at 100 kilometres per hour (KPH)? Probably. But have you ever suddenly skidded to a stop at that speed? Take a moment to imagine this and then watch the animation below.
You may not have noticed this at the time but the speed at which you were travelling is mathematically related to the length of your skid marks.
If you were to take a vehicle and measure the length of the skid marks when travelling at various speeds (such as 100kph, 90kph, 80kph, 70kph, and so on) you would discover that there is a quadratic relation between the speed and the skid length.
Why is mathematically defining this relation useful in the real world? A crime scene analyst can measure the length of your skid marks and determine whether you were moving at an unsafe speed. Solving this problem many years ago has help police recreate crime scenes (and to assign blame, if any) for countless traffic accidents.
We will return to this skidding scenario at the end of this learning activity. For now, let’s pause to take a look a someone who taught high school math to students who didn’t like high school math.
The Importance of Thinking About a Problem and Trying to Solve It Yourself.
Dr. Dan Meyer is an influential leader in math education.
Here is his bio:
Hi. I’m Dan Meyer. I taught high school math to students who didn’t like high school math. I have advocated for better math instruction here and on CNN, Good Morning America, Every Day With Rachel Ray, and TED.com. I earned my doctorate from Stanford University in math education and I’m currently the Chief Academic Officer at Desmos where I explore the future of math, technology, and learning. I have worked with teachers internationally and in all fifty United States. I was named one of Tech & Learning’s 30 Leaders of the Future. I live in Oakland, CA.

Take a moment to watch a clip from Dr. Meyer’s Ted Talk (Opens in new window)where he discusses the importance of getting students to think about a problem and how to solve it before given the steps to do so.
Dr. Meyer explains why he works for Desmos (Opens in new window). This is an online graphing platform that you may find useful throughout this course.
How do you think assessing a problem before given the steps to solve it will:
- Increase your learning?
- Increase your retention?
- Increase your interest?
This course is designed to not only teach you the fundamental background needed, but also to get you thinking about why you are doing the processes and, most importantly, to get you interested in math.
One way we will try to make the material interesting is to apply it to your everyday life.
Can you think of ways you use math in your life?
Finances, measuring, building, determining when you will arrive somewhere, calculating tips, trajectories when playing sports, etc.
Your Math Journal
You will be building a Math Journal throughout this course. which consists of 4 units: Introduction to Quadratic Functions; Analyzing Quadratic Functions; Exponential Functions and Trigonometry and Sinusoidal Functions. Within each unit are several learning activities.
At the end of each learning activity you will be prompted to create a journal entry, with suggestions about the content it should feature. These journal entries will serve as a summary of many of the important concepts in this course and will be useful when you are preparing for the unit assessments and the final exam. As such, they should be written in a way that will be most meaningful to you.
Please feel free to add any pieces of information that you think are important in addition to the suggested content.
Journal
At the end of the course, you will fine-tune 8 entries (two from each unit) from your math journal and submit them as your “Culminating Assessment - Math Journal.” (Opens in new window) They will be worth 15% of your grade.
You will see this icon whenever you should be adding to your math journal.
Near the end of each unit you will have the opportunity to submit one journal entry for feedback. You may choose to make any suggested edits based on that feedback and include the entry in your culminating assessment. If you do that, you will have 4 of the required 8 journal entries completed before the end of the course!
Each of the 8 journal entries that you submit should include:
- the journal entry for that learning activity
- evidence of learning from that activity (picture(s) of worked examples, written explanations, a summary sheet, etc.)
Your math journal entries can be presented in a variety of ways.
Here are some suggestions:
- handwritten journal (scanned)
- online journal
- video recordings
- pictures
- audio recordings
MCF3M Culminating Assessment: Math Journal Rubric
Please read through the rubric below to ensure full understanding of the assessment guidelines.
|
Success Criteria |
Levels |
|---|---|
|
(Please note: Not all success criteria apply to every journal entry) The selected journal entry shows: |
The selected journal entry demonstrates the success criteria: |
|
Level 4 (80-100)
Level 3 (70-79)
Level 2 (60-69)
Level 1 (50-59)
|
|
Success Criteria |
Levels |
|---|---|
|
(Please note: Not all success criteria apply to every journal entry) The selected journal entry shows: |
The selected journal entry demonstrates the success criteria: |
|
Level 4 (80-100)
Level 3 (70-79)
Level 2 (60-69)
Level 1 (50-59)
|
|
Success Criteria |
Levels |
|---|---|
|
(Please note: Not all success criteria apply to every journal entry) The selected journal entry shows: |
The selected journal entry demonstrates the success criteria: |
|
Level 4 (80-100)
Level 3 (70-79)
Level 2 (60-69)
Level 1 (50-59)
|
|
Success Criteria |
Levels |
|---|---|
|
(Please note: Not all success criteria apply to every journal entry) The selected journal entry shows: |
The selected journal entry demonstrates the success criteria: |
|
Level 4 (80-100)
Level 3 (70-79)
Level 2 (60-69)
Level 1 (50-59)
|

Determining the Type of Relation
from Graphs, Tables, and Equations
Topic 1
There are 3 ways to determine if a relation is linear, quadratic, or neither:
- From a Graph
- From a Table of Values
- From an Equation
Determining the Type of Relation From a Graph
Some relations result in a line on a graph. These are called linear relations. Some relations result in a parabola on a graph. Parabolas have a distinct shape that is shown below. These relations are called quadratic relations.
Can you think of two examples in your life where you see linear relations?
Speed, gas left in a car as you drive, etc.
Can you think of two examples in your life where you see quadratic relations?
Throwing a ball, hitting a golf ball, swings, diving, etc.
The Vertex
Parabolas have several distinct features to them, including the direction of the opening (either concave up or concave down) as well as a point known as the vertex. The vertex of a parabola will have distinct x-and y-coordinates (e.g. 0,0) and will also represent either the minimum or maximum y-value. Take a minute to explore how the vertex relates the to the shape and direction of a parabola by selecting and dragging the vertex to different positions.
Determining the Type of Relation From a Table of Values
Tim Jurinder owns TJ’s Garage. To fix a car, TJ’s Garage charges a base fee of $20, plus $40/h.
Let’s create a table of values to represent this relation. (The amount charged depends on the number of hours.)
Use 0, 1, 2, 3, 4 for the hours and then find these values for, Hourly Charge at TJ’s Garage:
|
Hours |
Charge |
|---|---|
|
0 |
20 + 40(0) = 20 |
|
1 |
20 + 40(1) = 60 |
|
2 |
20 + 40(2) = 100 |
|
3 |
20 + 40(3) = 140 |
|
4 |
20 + 40(4) = 180 |
Here is a graph of these values for, Hourly Charge at TJ’s Garage:
As you can see, the table of values results in a linear relation.
Determining Relation Type using First Differences
To confirm this algebraically, we can find the first differences. The first differences indicate how much the relation is changing vertically for each horizontal change.
If the first differences are constant, it tells us the relation increases/decreases by a constant amount meaning it is linear.
We will now find the first differences by subtracting the y-values in the table to determine if they are constant. We subtract the values bottom to top. Remember that, to use differences to identify the type of relation, the x-values must increase or decrease constantly.
| Hours | Charge |
|---|---|
| 0 | 20 |
| 1 | 60 |
| 2 | 100 |
| 3 | 140 |
| 4 | 180 |
| First differences |
|---|
| }
60 – 20 = 40 |
| }
100 – 60 = 40 |
| }
140 – 100 = 40 |
| }
180 – 140 = 40 |
Is the relation linear? Explain.
The relation is linear because the first differences are constant.
Determining Relation Type in a Table of Values using Second Differences
The same concept can be applied when determining if a relation is quadratic. If a relation is quadratic, the second differences are constant. The second differences are found by subtracting the first differences. The first differences of linear relations increase or decrease by a constant amount. The same is true for the second differences of quadratic relations.
Comparing two sets of data using two tables of values
Calculate the first and second differences to determine if these two tables represents a linear, quadratic, or neither relation.
| 0 | 4 |
| 1 | 6 |
| 2 | 8 |
| 3 | 10 |
| 4 | 12 |
| First differences |
|---|
| }
(subtract bottom to top) 6 - 4 = 2) |
| }
8 - 6 = 2 |
| }
10 - 8 = 2 |
| }
12 - 10 = 2 |
| Second differences |
|---|
| }
2 - 2 = 0 |
| }
2 - 2 = 0 |
| }
2 - 2 = 0 |
Again, calculate the first and second differences.
| 0 | 4 |
| 1 | 10 |
| 2 | 12 |
| 3 | 10 |
| 4 | 4 |
| First differences |
|---|
| }
(subtract bottom to top) 10 - 4 = 6 |
| }
12 - 10 = 2 |
| }
10 - 12 = -2 |
| }
4 - 10 = -6 |
| Second differences |
|---|
| }
2 - 6 = -4 |
| }
- 2 - 2 = -4 |
| }
(-6) - (-2) = - 6 + 2 = -4 |
How to Determine if a Relation is Linear or Quadratic using a Table of Values
Now determine if the tables above represent linear or quadratic relations.
Confirm the x values are increasing or decreasing by a constant amount
Are the x values in the tables increasing by a constant amount for both tables?
Yes.
Determine the first differences by subtracting the y values bottom to top
If the first differences are constant (the same), the table represents a linear relation
Based on the first differences, is the first table linear? How do you know?
Yes. The first differences in the first table are constant.
Based on the first differences, is the second table linear? How do you know?
No. The first differences in the second table are not constant.
If the first differences are not constant, determine the second differences by subtracting the first differences. If the second differences are constant, the table represents a quadratic relation.
Based on the second differences, is the second table quadratic? How do you know?
Yes the second table is quadratic. The second differences are constant.
Determining the Type of Relation From an Equation
Form of a Linear Equation
A linear function can be in the form:test
It represents a linear relation because it is a degree 1 polynomial; the highest degree on the variable is 1
Examples of Linear Equations
We always look for the degree after we expand and simplify.
Form of a Quadratic Equation
A quadratic function can be in the form:
It represents a quadratic relation because it is a degree 2 polynomial; the highest degree on the variable is 2
Examples of Quadratic Equations
Determining the Degree of a Relation
Without a Graph or Table of Values
Topic 2
In order to determine the degree of a relation without a graph or table of values, you must:
- First do all necessary multiplication (expanding).
- Second, do all addition/subtraction (simplifying).
- Third, look at the result and determine the degree of the relation.
Expand the Equation
When we expand we are multiplying terms.
You must remember to apply the distributive property when expanding into brackets; multiplying all terms together.
Simplify the Equation
When we simplify we are adding and/or subtracting terms.
We only simplify ‘like’ terms; terms with the same exponents on the same variables.
We add or subtract the coefficients of the like terms.
Practice determining the degree of a relation using a real-life example
You are moving to a new house that has a square shaped bedroom 3 times the area of the one you have now (which is also square shaped). Determine a simplified expression for your new bedroom if the length of the sides of your current bedroom can be described by the relation .
Set up equation if not given
Remember we are looking for the equation of a bedroom three times the area of the one shown.
(The formula for area of a square is ).
Expand the binomials by using the distributive property
Remember to write the binomial out twice because it is squared
Remember the distributive property means to multiply every term in one bracket with everything in the other bracket.

Expand the monomial by using the distributive property
Remember to multiply the number in front of the bracket with all terms inside the bracket

Simplify like terms
Remember to add and subtract the coefficients of the like terms
Therefore, a simplified expression for the area of the new bedroom is

Review Your Understanding of Determining the Type of Relation
In the Minds On section, you have read that Dr. Dan Meyer works at Desmos (Opens in new window). Take a minute to explore the Desmos site by creating a linear graph and creating a parabola. Screenshot your graphs to review for later.
Self-check
As a self-directed learner, you will be reflecting on your learning process and checking your understanding in order plan for success. Make a note of your understanding of the success criteria from today’s activity.
Journal
Create a table like this in your math journal (Opens in new window). Complete it using Desmos or any other graphing tool you have access to.
|
Linear Relation Graph Example from Desmos |
Quadratic Relation Graph Example from Desmos |
|---|---|
Review the success criteria
Rate your understanding on a scale of five to one.
Five means “I have a thorough understanding.” One means “I am confused.”
How will you work to improve your understanding where it is needed? One suggestion might to search out Mathify (Opens in new window) videos on the concepts to see if that helps.
Journal

Now take a moment to summarize, in your own words, how to determine if a relation is linear, quadratic, or neither from a graph, table, and an equation.
Here is a suggestion how the table you make in your math journal could be organized.
|
From a Graph |
From a Table of Values |
From an Equation |
|
|---|---|---|---|
|
Linear |
|||
|
Quadratic |
Summarize, in your own words, what it means to expand vs. simplify an expression
Further Practice with Quadratic Relations
Consider the relation . Complete the following table for this relation. When you’re finished, compare your answers to the suggested ones.
|
-4 |
-16 |
|
-3 |
-9 |
|
-2 |
-4 |
|
-1 |
-1 |
|
0 |
0 |
|
1 |
-1 |
|
2 |
-4 |
|
3 |
-9 |
|
4 |
-16 |
| First differences |
|---|
| }
7 |
| }
5 |
| }
3 |
| }
1 |
| }
-1 |
| }
-3 |
| }
-5 |
| }
-7 |
| Second differences |
|---|
| }
-2 |
| }
-2 |
| }
-2 |
| }
-2 |
| }
-2 |
| }
-2 |
| }
-2 |
From the table data, how do you know this is a quadratic relation?
In the table, the second differences are constant, so the relation is quadratic.
From the equation, how do you know this is a quadratic relation?
The degree of the equation is 2, so the relation is quadratic.
Graph the relation.
What is the direction of opening of the parabola?
The parabola opens downward, so it is concave down.
State the vertex. Is it a minimum or a maximum point?
The vertex is (0,0) and is a maximum point.
What connection can you make between the second differences and the direction of opening of the parabola?
When the second differences are positive, the parabola is concave up.
When the second differences are negative, the parabola is concave down.
What connection can be made between the concavity of a parabola and whether it has a maximum (highest) or minimum (lowest) point?
A parabola that is concave down has a maximum point, and a parabola that is concave up has a minimum point.
Another Practical Example of Quadratic Relations in a Real Life Scenario
Quadratic relations arise in many real-world situations, as shown in the following example about skid marks.
When investigating car accidents, the police measure the length of skid marks on the road. The investigator knows that the distance a car skids depends on the speed the car is travelling before the brakes are applied.
Suppose the driver of a car puts on the brakes and skids through a red light at an intersection. The investigating officer uses the following table to determine the car’s speed:
| Speed (km/h) | Skid length (m) |
|---|---|
| 0 | 0 |
| 10 | 0.7 |
| 20 | 2.8 |
| 30 | 6.3 |
| 40 | 11.2 |
| 50 | 17.5 |
| 60 | 25.2 |
| 70 | 34.3 |
| 80 | 44.8 |
| 90 | 56.7 |
| 100 | 70 |
Using pencil and paper, answer the following questions on your own. When you’re finished, compare your answers to the suggested ones.
Draw a curve of best fit for this data.
On a sheet of grid paper, draw a horizontal and vertical axis.
- The horizontal axis will represent Speed (km/h), and the vertical axis will represent Skid length (m).
- Select a suitable scale for the horizontal axis; for example, let one square represent 10 km/h. For the vertical axis, let one square represent 20 m. Hint: leave room on your graph so you can predict the speed of a car if it leaves an 80 m long skid mark.
- Graph the ordered pairs (0,0), (10,0.7), (20,2.8), (30,6.3), and so on from the table of values.
- Draw a smooth curve to connect the points.
- Title the graph Skid length vs. Speed.
Police officers observed that a skid mark was 80 m long. Use the curve to estimate the speed of the car.
- Extend the graph by following the same curve/trend in the data.
- Locate 80 m along the vertical axis.
- Draw a horizontal line across to the extended graph.
- Mark this point.
- Draw a vertical line down to the horizontal axis.
- Estimate the speed of the car
Therefore, the car’s speed was approximately 107 km/h.
Determine the second differences to confirm whether or not this is a quadratic relation. Complete the table to help you.
| Speed (km/h) | Skid Length (m) |
|---|---|
| 0 | 0 |
| 10 | 0.7 |
| 20 | 2.8 |
| 30 | 6.3 |
| 40 | 11.2 |
| 50 | 17.5 |
| 60 | 25.2 |
| 70 | 34.3 |
| 80 | 44.8 |
| 90 | 56.7 |
| 100 | 70 |
| First differences |
|---|
| }
0.7 |
| }
2.1 |
| }
3.5 |
| }
4.9 |
| }
6.3 |
| }
7.7 |
| }
9.1 |
| }
10.5 |
| }
11.9 |
| }
13.3 |
| Second differences |
|---|
| }
1.4 |
| }
1.4 |
| }
1.4 |
| }
1.4 |
| }
1.4 |
| }
1.4 |
| }
1.4 |
| }
1.4 |
| }
1.4 |
Based on what you found, is this a quadratic relation? Explain why or why not.
The second differences are constant, which confirms that the relation is quadratic.
Why do you not use negative length or speed values in this situation?
Negative values do not make sense for this situation because negative speed does not apply in real-world situations, nor does negative skid length. Speed and length are measured in positive values only.
Note: Extrapolating is the process of extending a graph to make predictions outside of the given data set.