

For each of the following images, identify whether the image represents a linear, quadratic, cubic or quartic function and explain your choices. Your response can include more than one function.

Type of function?
Linear
How do you know?
The path of the airplane can be described using a straight line.

Type of function?
Quadratic
How do you know?
I see a U-shaped symmetrical curve.
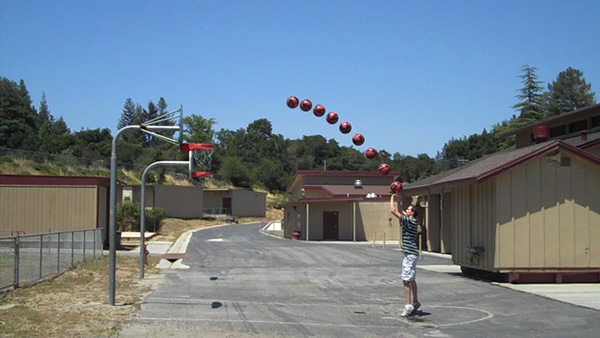
Type of function?
Quadratic
How do you know?
The path of the basketball can be described using a downward facing parabola.
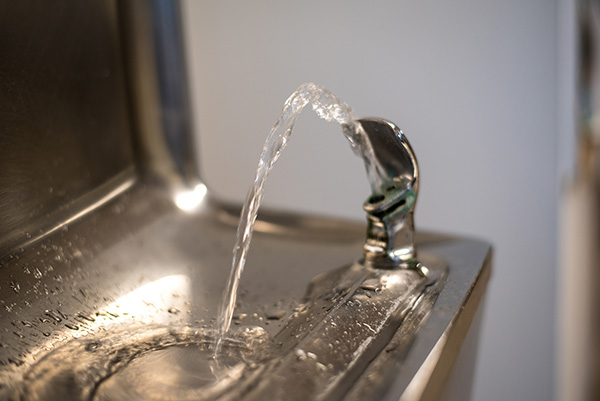
Type of function?
Quadratic
How do you know?
The path of the water can be described using a downward facing parabola..

Type of function?
Cubic and quartic
How do you know?
Parts of the roller coaster are made up of w-shaped curves and s-shaped curves

Type of function?
Quadratic
How do you know?
The Macdonald’s sign is made up of 2 U- shaped curves

Notebook

Explore your environment to find at least four (4) real life examples of polynomial functions. Take pictures and add them to your math notebook.
For each picture, identify the type of polynomial function and write a brief explanation of how you know.
Culminating Task: Making the World a Better Place
Part of the evaluation of this course will be in the form of a culminating activity, worth 15% of your final course work.
In this activity you will explore connections between the concepts learned in this course and environmental issues. Specifically, you will create a mathematical model and visual representations to provide evidence to convince investors that a way to improve an environmental issue of your choice would be a worthy project in which to invest.
Overview
You have decided that you are going to make a pitch to the hosts of a reality TV show where entrepreneurs request funding for projects, or products, designed to reduce the damage to the environment caused by human activity.
Your pitch must combine a compelling reason why your initiative should be supported, with evidence that justifies the need for action. You will research and collect secondary data, use the data to create graphical and algebraic models, make predictions based on your algebraic model and create a visual presentation using the media/ platform of your choice (PowerPoint, WordPress, Prezi, Weebly, iMovie, Show Me, Blogger, Tumblr, YouTube, etc.). The function used to create your algebraic model must be one of the types of functions (polynomial of degree 3 or higher, exponential, logarithmic or trigonometric) covered in this course.
Task Checklist
This assessment is out of 60 marks and is worth 15% of your final mark. You will submit your Culminating Task upon completion of Unit 4 where you will be prompted at the end of the final learning activity to submit your assessment for feedback and a grade by selecting the “Assignments” link and following the submission directions.
Your proposal should contain the following elements:
| Task Checklist Item |
Weight (No. of marks) |
|---|---|
| A description of the environmental issue that needs to be addressed | 2 |
| A description of the product or change in behaviour that could reduce the damage caused by the environmental issue, with justification. | 5 |
| A set of secondary data from a reliable source, in table form, pertaining to the environmental issue. It must be appropriate for modeling with one of the types of functions studied in this course: polynomial of degree 3 or higher; exponential; logarithmic or trigonometric. A spreadsheet (Excel, Google Sheets etc.) could be used to create the table and would facilitate graphing the data. | 8 |
| The APA reference for the data set. | 2 |
| A scatter plot of the data including appropriate titles, scales and units, created with the graphing technology of your choice. | 5 |
| An algebraic model that fits the data. The model can feature one of the functions mentioned above or could be a combination or composite of two of those functions. The choice of model should be based on visual inspection of data trends observed and does not need to be supported by statistical analysis, which is beyond the scope of this course. | 5 |
| An explanation of how the algebraic model was determined, including justification for the choice of parent function (or combined or composite function) and any transformations used to model the data. | 5 |
| Restrictions on the domain of your function and a description, including justification, of potential limitations of the algebraic model as it applies to correlation with the data and the ‘real world’ context. | 5 |
| A graph of the algebraic model, including appropriate titles, scales, units, and restrictions on the domain, created with graphing technology, and superimposed on the scatter plot. | 5 |
| At least one calculation using the algebraic model to make a prediction, or for emphasis. | 3 |
| A brief sales pitch, using the graph as evidence, and calculations involving the algebraic model to make predictions to convince the reality TV show panel that your proposal deserves support. | 10 |
| Correct use of mathematical terminology and conventions throughout. | 5 |
The teacher will assess your work using the following rubric. Before submitting your assessment, review the rubric to ensure that you are meeting the success criteria to the best of your ability.
You can access and download the following Culminating Task document, containing the activity overview, instructions, rubric and checklist, for your reference.
Choosing an Environmental Issue
You want to select an issue that you feel passionate about. Your issue can be global, like plastic pollution in the oceans, or local, like challenges faced by turtle populations in a specific Ontario county. Perhaps you already know the issue you will address. If not, internet searches using key phrases like: environmental issues; environmental initiatives; environmental action; environmental organizations or climate change will give you broad categories to consider.
Before you begin collecting secondary data, you might be wondering how to evaluate scientific secondary sources to determine the quality of the information that you’ve encountered. That is, is it reliable?
Evaluating Scientific Information:
First, be aware of “pseudoscience” (“false science”). Pseudoscientists make claims that may appear scientific, but do not follow scientific principles. Distinguishing between science and pseudoscience can be difficult.
When trying to discern whether something is scientific, check the following:
- Interest: Who is funding the research and who may profit from it? Biased organizations may give themselves neutral-sounding names. An organization will often have an interest in the outcome of a study they are funding.
- Author and Publisher: Who conducted the research? Where was it done? Where was it published? Look at the background of the people involved in the research, if possible. What kind of training have they had? Have they done extensive research in the field? Have they published other papers on the topic? Do others frequently cite them? Was the work conducted at an established facility, which could provide the support necessary to conduct thorough research?
Scientists publish their results in peer-reviewed journals so that others in the same field can critically evaluate their work. View with suspicion any discoveries that are “secret” or rely on “secret formulas”. Results that have been originally published in journals such as Science, Nature, the New England Journal of Medicine, and so on will have been examined more closely, and are therefore are more reliable, than those that are directly announced to the media.
- Hypotheses: Are hypotheses testable and capable of being falsified? Hypotheses and theories (even those which cannot be tested directly) should be able to [be] used to make predictions and allow the collection of evidence to test those predictions. Often pseudoscientific claims cannot be proven wrong by any possible evidence. For example, there is no way to disprove the claim that only someone with special powers can sense a certain phenomenon.
There is a large body of knowledge in science that is not influenced by trends in public opinion and is not likely to change. However, scientific ideas should be capable of changing should new evidence arise. In contrast, ideas in pseudoscience either stay the same (if there is an unchanging idea behind them) or change randomly (if criteria for accepting ideas and rejecting others do not exist).
…
There is a lot of information on the internet, but not all of it is appropriate for you to use. You can use the CRAAP test to evaluate the suitability of the information that you find. Access this summary of The CRAAP Test (Opens in new window) to learn more about how to evaluate all types of information, including non-scientific information.
You could also browse the websites of trusted organizations like the following:
David Suzuki Foundation (Opens in new window)
Sierra Club Canada (Opens in new window)
Assembly of First Nations (Opens in new window)
Environmental Working Group (Opens in new window)
World Wildlife Fund (Opens in new window)
Smaller, community-based organizations often provide valuable local information, like the Rideau Environmental Action League. (Opens in new window)