Learning goals
We are learning to:
- use appropriate terminology related to human population and demographics
- analyze the effects of human population growth, personal consumption, and technological development on our ecological footprint
- assess the effectiveness of some Canadian initiatives intended to help people in developing countries
Success criteria
I am able to:
- explain demographic changes that have occurred in the history of human population
- explain issues related to rapid human population growth in terms of the economic, social and the environmental impact
- identify and describe a Canadian initiative in a developing country


Welcome to Grade 12 Biology. You will begin your exploration of biology by studying human populations.
Earth is the third planet from the Sun and the only astronomical object known to harbor life. Humans have taken the center stage in this journey as life on earth has evolved.
The human population has grown exponentially over the years. Before we begin our look at the human population, do you know how many humans live on Earth at this moment?
Wondering how close you were?
By the end of 2020 it is estimated that the human population will have reached approximately 7.8 billion.
Notebook
Setting up a notebook
You will need a notebook for this course. You may choose to use a paper notebook and handwrite your notes. Or, you may choose to create a document on your computer using Microsoft Word, Office 365, Google Drive or some other file storing network. Consider carefully which works best for you. You should summarize new learning and add notes to the notebook at the end of each learning activity. It is important for learners to actively think and make connections when learning new content. This active thinking, note-taking and brainstorming while reading greatly increases success and comprehension.
It’s important to note that throughout this course you will be asked to brainstorm ideas and make rough notes as part of the learning process.

Notebook
Now is your chance to begin your notebook:
Reflect and list issues that are impacted by a large increase in the human population. Your answer focus should be on Environmental, Economic and Social factors.
In this unit you will cover the following topics related to populations:

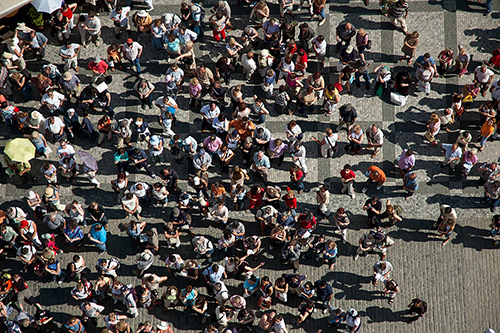
For most of human history, the human population size was under 1 million. Humans had minimal impact on the earth and its ability to sustain life. Today, there are over 7.5 billion people on the planet.
Because of the recent explosive growth in the human population, we are now exceeding the capacity of the earth to support us. 140 people are added to the human population every minute. You will learn how we got to this point and what we can do to control our population growth.

Natural ecosystems are under threat because of our over-consumption of resources and creation of pollution. You will learn the consequences of this and discover how the “tragedy of the commons” leads people to overexploit resources, even when they know it is the wrong thing to do.

Finally, you will learn how Canadian aid and technology is being used to help developing countries achieve sustainable development, so that they no longer have to face food shortages, disease, and other problems associated with their rapidly expanding populations.
History of human population growth

As of 2018, the global human population was approximately 7.5 billion, adding 75 million more people to the earth than there were the year before. That’s like adding 2.3 times the population of Canada to the earth in one year.
It is expected that the human population will reach 9.4 billion by the year 2040, but this rapid increase in human numbers is a very recent phenomenon.
Story of human population growth
Here you will learn about the growth of Human Population over the years.
130,000 years ago - up to 7000 years ago:

From the time of the origin of our species, human populations were small and scattered. Globally, they totaled only about 1 to 5 million. During this period, humans were mostly organized into small, nomadic hunter- gatherer groups of around 50 individuals.
5000 BCE:

A modern form of agriculture emerged. This featured large-scale intensive cultivation of land, irrigation, and the use of a specialized labour force. Domestication of animals, including cattle and sheep, also began around this time. The discovery of large-scale agriculture led to local food surpluses.
This allowed many thousands of people to give up their nomadic lifestyle and settle together in the same place. Surplus food encouraged high birth rates and helped reduce mortality due to disease and seasonal starvation.
1:

Despite these improved conditions, by the year 1, it is estimated that there were only about 200 million people on earth. In fact, for over 16 centuries, the human population was characterized by very slow growth.
1804:
It was not until 1804 that the world population reached 1 billion.
1805-2010:

However, in just the last two centuries, our population has increased by 5.8 billion people.
2011-2100:

In 2017, the world population is 7.5 billion and the projected world population in 2020 is over 8 billion people. It is projected that 1-2 billion people will be added to the world population every 10 years.
Try It!
Now that you have a good understanding of how Human Population has grown over the last century, try to complete a graphing activity using graphing software such as Microsoft excel or by hand using graph paper.
1. Using the table below plot time (years ago) on the x-axis and world population size on the y-axis. Start the x-axis at approximately 12,000 years ago (10 000 BCE).
| Date | Global population (in millions) |
|---|---|
| 10,000 BCE | 1 |
| 8000 BCE | 5 |
| 6000 BCE | 10 |
| 4000 BCE | 20 |
| 2000 BCE | 35 |
| 1 | 200 |
| 1804 | 1000 |
| 1927 | 2000 |
| 2000 | 6070 |
| 2010 | 6800 |
| 2017 | 7500 |
2. Curious if you got the graph right? Have a look at the answer below.

Use the information from your graph to answer the questions below:
- Describe the trend in human population growth.
- Does it indicate the presence of more than one growth pattern? Yes / No
- Explain why you chose Yes or No as your answer?
- The trend is that of small, gradual increases in population over the time period from 10000 to 2000 years ago. This is followed by steep increases during the last 1000 years, especially over the last 200 years.
- Yes
- The trend suggests Two growth patterns: the first is gradual, before about 2000 years ago, and the second shows an exponential increase during the last few hundred years.
Resource use and carrying capacity
So, what factors affect the growth of the human population? Any study of human population dynamics must include an assessment of our resource use. In this section, you will learn about the types of natural resources that humans consume and how this relates to the concept of human carrying capacity.

On August 8th, 2016, the Global Footprint Network reported that the human population on earth had already consumed its yearly production.
This meant that we were borrowing three months of global production from the next year, 2017. In other words, we were using up the renewable resources of the earth faster than they could be replenished.
People around the world vary in the amount of resources they use. At one extreme, the neediest people often struggle to survive; they are often unable to obtain sufficient resources to meet even their basic needs. At the other extreme, the richest people have much greater access to resources and tend to consume resources beyond what they might need to live comfortably.


Because of the huge differences in resource use among people, the impact of human population growth on the earth depends on how resources are used and distributed. Population growth among the poorest people could have little additional impact on the earth, while small increases in the number of the world’s richest people could have major consequences.
Types of resources
Overpopulation does not depend only on the size or density of the population, but on the ratio of population to available sustainable resources. It also depends on how resources are managed and distributed throughout the population
The following provides an overview of the main categories of resources that humans consume.

75% of planet Earth is covered in water. 97.5% of that is ocean and 2.5% is freshwater. 70% of freshwater is divided into glaciers and ice caps and the remaining 30% into land surface water, such as rivers, lakes, ponds and groundwater. Most of the freshwater resources are either unreachable or too polluted, leaving less than 1% of the world’s freshwater, or about 0.003% of all water on Earth, readily accessible for direct human use.
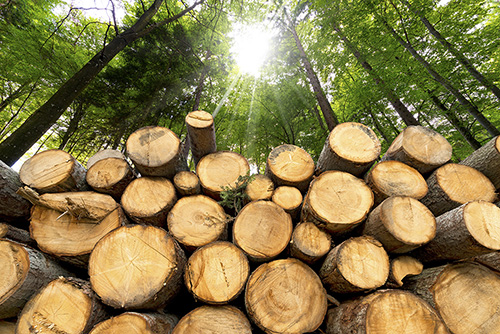
Trees are also highly necessary for human existence due to the absorption of carbon dioxide and other gases, the production of oxygen, and the food, fuel and habitat they offer. However, trees also add ease and luxury to human lives as cellulose (powdered wood pulp), and other tree components, are often added to everyday products, from tasty snacks to art supplies.
The relationship between overpopulation and environmental impacts are often interrelated and complex. Overpopulation has resulted in the growth of urban settlements which in turn increases deforestation, land degradation, waste and pollution. Overpopulation is accompanied by growing demands for food and fresh water.
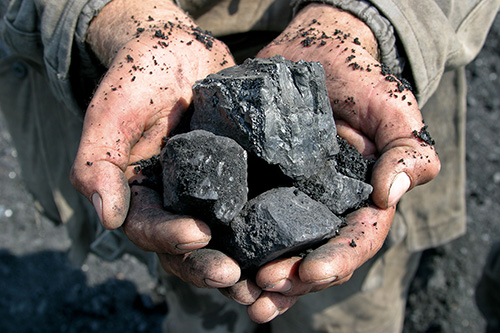
Non-renewable energy comes from sources that will run out or will not be replenished in our lifetimes—or even in many, many lifetimes. Most non-renewable energy sources are fossil fuels: coal, petroleum, and natural gas. Carbon is the main element in fossil fuels.
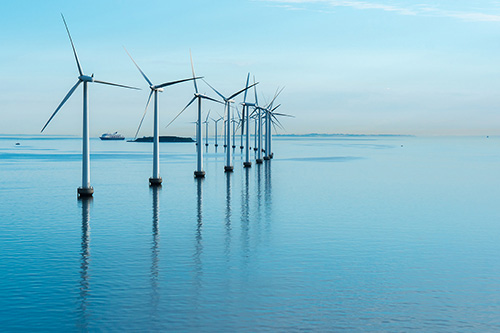
Renewable energy is energy produced from sources that do not deplete or can be replenished within a human’s life time. The most common examples include wind, solar, geothermal, biomass, and hydropower. This is in contrast to non-renewable sources such as fossil fuels.

Minerals are solid, naturally occurring inorganic substances that can be found in the earth’s crust. Metals are elementary substances, such as gold, silver and copper that are crystalline when solid and naturally occurring in minerals. They often have the characteristics of being good conductors of electricity and heat, of being shiny in appearance and of being malleable.

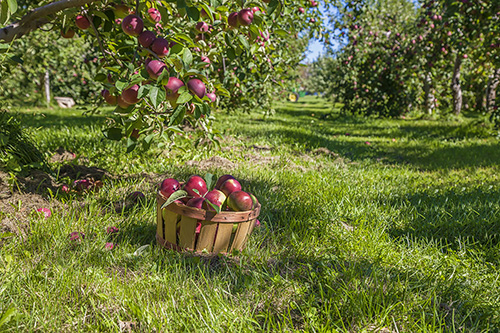
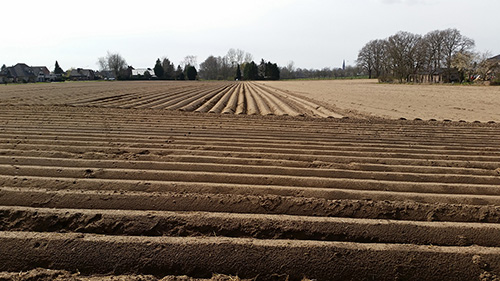
There is great pressure on the natural resources (water, land) due to overpopulation. Among all the natural resources, Land is the most important one. All agriculture, animal and forestry productions depend on the land productivity.
Human Carrying Capacity
Carrying capacity means the population size for a given species that a specific environment can sustain indefinitely, given the food, habitat, water, and other necessary resources available.
While the term is relatively new, the concept has been in development for over 200 years
 Garrett Hardin
“A finite world can support only a finite population; therefore, population growth must eventually equal zero.” (Garrett Hardin, “The Tragedy of the Commons,” 1968)
How many people can our planet sustain?
This question is difficult to answer. It depends on:
- what standard of living you think is desirable
- whether advances in technology will continue to find new resources
- how much of the earth we want to leave in a natural state?

 Robert Malthus
In 1798, Thomas Robert Malthus, an English reverend and mathematician, published An Essay on the Principle of Population. In his essay, Malthus hypothesized that "the power of population is indefinitely greater than the power in the earth to produce subsistence for man.”
In other words, the potential growth rate of human populations will always exceed the growth rate in their food supply. Malthus observed that human populations can increase very quickly, as more births lead to more reproductive adults, which leads to even more births (an exponential process).

Food production, however, tends to increase more slowly. It grows by only an incremental amount. He reasoned that “this implies a strong and constantly operating check on population from the difficulty of subsistence,” meaning that the amount of food available will continually act to limit human population size.
According to Malthus, human population size is regulated by its food supply when the number of people exceeds the available food supply.
The regulations on human population growth are either:
- voluntary (for example, birth control, abstinence, or delayed marriage)
- involuntary (for example, famine, disease, or war).
Ecological Footprint
To determine the human carrying capacity of the earth, we need to quantify the amount of resources used by each individual. One way to calculate this is by using a measure called the ecological footprint.

An ecological footprint is a measure of a person’s daily demands on the earth’s ecosystems.
It is the amount of biologically productive area of the earth (land and sea) needed to produce the resources a person consumes, in addition to the area needed to absorb and treat the resulting waste. It is measured in global hectares (gha).
What does a global hectare represent?
A global hectare represents the biological productivity found on one “average” hectare (a measure of area) of the biologically productive parts of the earth. It is estimated that each person on earth needs 2.1 gha to meet their needs, but this is not distributed evenly.
North Americans consume more resources per capita than anyone else on the planet.
Factors Affecting Human Population Growth
So far you have studied the growth rate at which the human population has grown over the years, in this section you will learn about the factors affecting this growth.
Demographic transition and economics
While global population size is still rising, it is not increasing equally in all parts of the world.

In developed countries:
- birth rates have recently declined.
- birth rates in some countries are so low that their populations would begin to shrink if they didn’t use immigration to keep their populations stable.
Yet each of these countries at one time experienced high rates of population growth.
Populations grow and shrink because of differences between their birth and death (mortality) rates.
Populations:
- grow when birth rates exceed mortality rates. (birth rate > mortality rate)
- shrink when mortality rates exceed birth rates. (birth rate < mortality rate)
- remain stable when the two rates are similar. (birth rate = mortality rate)
Changes in the ratio of birth rates to death rates cause populations to move through stages:
- going from stability to high growth
- then back to stability
- and in some cases, even into decline
Movement through these stages is called a demographic transition.

This model depicts how changes in birth and death rates can cause populations to move through the demographic stages. Note that this model does not consider the effects of immigration or emigration. Countries with high levels of immigration or emigration may show population growth patterns that are different from those in this model.
A brief explanation of the stages in this Demographic transition model:
| Stage | Explanation |
|---|---|
| 1 | Birth and mortality rates are similar, so the population size remains stable. |
| 2 | Mortality rates start to decline, but the birth rates stay relatively high. This causes the population size to start growing exponentially. |
| 3 | Birth rates are starting to fall and the decline in the mortality rates has levelled off. Birth rates are still higher than mortality rates, so the population is still increasing, but it is starting to slow down. |
| 4 | Birth and mortality rates are now similar again, so the population stops growing and eventually becomes stable. |
| 5 |
If the birth rate continues to decline and falls below the mortality rate, then the population will enter stage 5. Here, the population size starts to decrease because there are more deaths than births. |
The pattern of demographic transitions in most developed nations over the last century followed the population size curve.
Populations went from:
- stable (stage 1)
- high growth (stages 2 and 3)
- stability (stage 4)
- in some cases, into decline (stage 5)
This was largely because of economic and social factors.
Human population growth began to rise exponentially around 250 years ago. Prior to that, growth was relatively slow, as the number of births barely kept ahead of the number of deaths. Gradual advances in agriculture and the rise of complex societies helped increase birth rates, but disease and wars kept the mortality rates relatively high. This kept the global population in stage 1 for thousands of years.
Population growth phase in developed countries
In the mid-1700s, the Industrial Revolution began in Europe and North America.
- New machines and factories could make goods faster and more cheaply than ever before.
- People migrated from farms into the growing cities to find work.
- The Industrial Revolution brought a higher standard of living and lower mortality rates for many people.
- Modern farm machinery and fertilization meant that more food could be harvested from the same amount of land, employing fewer people.
Over the next 250 years, advances in sanitation, public health, and medicine led to a dramatic reduction in the mortality rate.

People in these countries had always been used to high mortality rates, especially of infants.
- Because of this, they developed a culture where having many children was seen as an insurance policy to ensure that some of them lived to adulthood.
- If you lived on a farm, a large number of children meant that you would have more people on the farm to help grow more food.
- The culture was built on having large families and there was pressure on young women to start having families at an early age.

It generally takes several generations for cultural values to respond to changing mortality rates. As the Industrial Revolution progressed, the new lower mortality rates combined with traditionally high birth rates created a period of exponential growth.
The Industrial Revolution did not spread as fast to developing countries.
- Most were still dependent on small-scale agriculture until the early 1900s.
- Gradual improvements in medical care and agricultural practices helped to reduce their mortality rates. This led to small increases in their population.
- However, infant mortality rates remained relatively high, so population growth was moderate.
- Risk of famine was also high.
For example, in India, during the Bengal famine of 1943, nearly 4 million people starved to death. For the next 20 years, India had to import food to feed its growing population, just to prevent mass starvation.
This all changed in the 1960s, when agriculture and food production improved dramatically during a period called the Green Revolution.
In India, an American plant breeder named Norman Borlaug helped improve agricultural productivity.
- He bred new varieties of wheat and rice that produced higher yields.
- Growing these new crops in combination with synthetic fertilizers, mechanized irrigation, and petroleum-based herbicides and pesticides, caused food production to skyrocket.
- The new crops grew quickly in the subtropical climates.
- Farmers could now often harvest two crops in a season, where before they could only harvest one.
 Norman Borlaug
The practices of the Green Revolution spread around the world.
By the 1970s, farmers had tripled their agricultural production in India, Asia, and countries around the eastern Mediterranean. For his work, Borlaug won the Nobel Peace Prize in 1970. Since then, further improvements in crop varieties (including genetic modification), irrigation, pest control, and fertilization have continued to improve yields and nutritional content

Food production increased around the world, so most people in developing countries no longer experienced regular periods of starvation. Mortality rates dropped, but just like in developed countries, birth rates remained high. This led to a period of exponential population growth.
Population stability phase
In the early 1900s, most developed countries began to experience significant changes in their social structure.
A reduction in family size was seen due to:
- widespread education
- the social advancement of women
- urbanization
- economic opportunity
- low risk of infant mortality
As people moved away from farms into the cities, they did not need to have as many children for labour. Also, living space in cities was smaller, so it was more expensive to house a large family
As a result, populations in many developed countries entered stage 3, as shown in the graph. Their population size was still increasing, but the rate of this increase was slowing down.
Today, with further decreases in birth rates, most developed countries have entered stage 4 (stability) or even stage 5 (a decline).

Birth rates have continued to decline.
Now, the average number of children born per woman in developed countries is about 2.1. This is barely above the number needed to replace the population (about 2.1 children per woman).
In many developed countries, like Japan and Western Europe, the number is below 1.5. Canada’s rate is about 1.6. Countries with a level of below 2.1 will eventually experience a decline in population size unless they compensate with increased immigration.
In developing countries, the birth rates are still high, with each woman having an average of 4.5 children.
Understanding checkpoint: Demographic transition and economics
Before we move on to the next topic, let’s see how well you understand demographic transition and economics.
Try It!
What caused the human population to rapidly increase, around 250 years ago?
The Industrial Revolution allowed humans to extract more resources, develop advanced medical technology, and provide far more food to many more of the world’s wealthier people.
Future population trends
Despite some high-growth countries, populations in most countries are now showing signs of slower growth.
This is mainly due to:
- social and economic development
- a lower risk of infant mortality
- continuing urbanization

Globally, however, there are about:
- 20 births per 1000 people/year
- eight deaths per 1000 people/year
This translates into:
- an annual growth rate of 1.1%, which means that about 75 million more people are added to the earth every year.
- about 200,000 people added per day or about 140 people added per minute!
At this rate, the world’s population would double in about 40 years.
Interesting to note: It took over 100,000 years for the human population size to reach 1 billion. It took only another 123 years to reach the next billion, and only 32 years after that to reach 3 billion. Since then, we’ve been adding a billion people every 12 to 15 years or so.

How high will the population go?
The answer depends on constantly changing factors that influence birth and mortality rates, such as:
- social and economic development
- advances in medicine and agriculture
- shifts in cultural attitudes.
These vary by region, so population patterns will not be the same everywhere.
Estimates vary widely but most studies agree that the rate of global population growth is slowing down significantly. For example, in 2007, the United Nations Population Division projected that the world’s population will likely surpass 10 billion in 2055 and then begin to decline because of economic factors, health concerns, land exhaustion, and environmental hazards.
Understanding checkpoint: Future population trends
The United Nations Population Division predicts that global human population size will peak sometime this century and then begin to decline.
Try It!
Consider reflecting and gathering your thoughts to answer the questions below. Compare your answers with the suggested answers, revisit the topics if your answers vary to a great extent.
What are three factors that will likely cause this decline?
- A lowering of global birth rates to below the replacement level of 2.1
- Economic development and urbanization, changing cultural attitudes towards family
- Land exhaustion and environmental degradation of the earth will limit our ability to feed everyone.
Where would the decline in population growth rate be the most dramatic? Why?
Developing countries that progress towards more development. Countries like India and China are becoming wealthier and are developing a large population of middle-class citizens who will tend to have fewer children.
It is also possible that environmental degradation could slow population growth rates in some developing countries by keeping infant mortality rates high
Environmental consequences of human population growth
The pollution we create and the natural systems we degrade all lower the carrying capacity of the earth to support life. In this section, you will learn about the environmental impacts caused by human activities.
The environmental impacts of human population growth on the planet affect all ecosystems. These impacts generally arise from three main causes:

The Green Revolution created new and unforeseen environmental problems for developing countries.
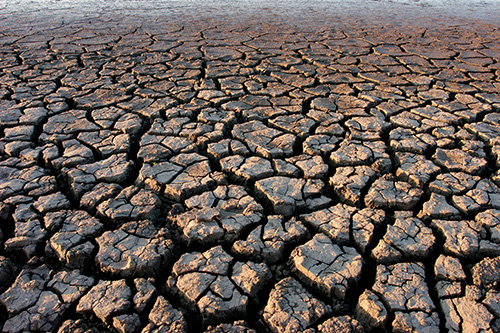
By the 1990s, decades of constant irrigation had caused many local wells to run dry.
Also, over-irrigation caused many fields to eventually become too salty to grow food crops. This is because natural salts in the irrigation water get left behind in the soil after the water evaporates.


Developed countries suffered from these environmental problems too. In addition, they had pollution problems unique to their industrialized societies. The production of new materials and chemicals released new kinds of chemical pollution.
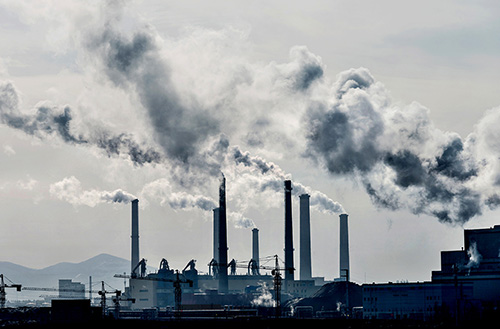
Humans use a lot of fossil fuel energy to power industry and transportation, and to support their daily lives. Burning fossil fuels releases gases, including carbon dioxide, which enter the atmosphere. Carbon dioxide is called a greenhouse gas because it traps heat close to the surface of the earth, causing global warming. We have been releasing carbon dioxide into the atmosphere since the beginning of the Industrial Revolution. Today, the buildup of carbon dioxide gas in the atmosphere is high enough for it to threaten to change the earth’s climate.
Most experts believe that there is a direct relationship between carbon dioxide emissions and global warming. Climate change may be the biggest environmental threat we face.

When we consume resources like wood, water, or land, we prevent them from being used by other organisms. When we use the land for our needs we take away habitat from other organisms and alter the ecosystem. This removes food sources for other animals, prevents nutrients from re-entering the soil, and releases waste.
In just over 200 years, we have destroyed much of the earth’s natural areas in order to meet our resource needs. Forests and grasslands have been especially damaged. For example, nearly half of all tropical rainforests have been destroyed to create farmland and to harvest timber. Their destruction continues at a rate of 1% per year. At this rate, there will be none left in about 50 years from now.
Discover More
Tragedy of the Commons
Why do humans over-consume so many natural resources, even when they know the environmental consequences?
One reason is known as the “tragedy of the commons.” The phrase comes from an example about cattle grazing, written in 1968 by Garrett Hardin, an ecologist. (You saw one of his quotes earlier in the lesson.)
A “commons” is a shared field for grazing cattle that is open to everyone. Because the land is not owned or controlled by anyone, there is no reason to help conserve the grass. If you try to conserve the grass by grazing fewer cattle, your competitor will use the resource that you saved in order to graze more cattle for himself and make money at your expense. So, it does not pay any of the cattle ranchers to try and conserve the grass. The resource is doomed to be over-exploited until it is gone. Everyone knows they are destroying the resource, but they feel they have no choice. That is why it is a called a tragedy.

The tragedy of the commons appears in many shared resources, especially in the ocean fisheries. Because no one owns the fish, no one benefits from conserving them. If you don’t catch as many fish as you can, then someone else will. You will study a dramatic example of this in a case study of the Atlantic cod, in a later lesson.
Understanding checkpoint: Environmental consequences of human population growth
Try It!
Check your overall understanding of Environmental Consequences of Human Population Growth by answering these questions.
Canadian aid to the developing world
The problems caused by rapid population growth and an uneven distribution of resources in the developing world are severe.
Billions of people are affected by:
- poverty
- malnutrition
- lack of educational opportunities
- environmental degradation

Canada is helping developing nations deal with their problems mainly in two ways:
- social and economic development
- advances in biotechnology that can help feed a hungry world
Canadian social and economic aid
Currently, Canada delivers much of its aid to developing countries through:
- The federal government ministry
- Foreign Affairs
- Trade
- Development Canada
Formerly, it was done through the Canadian International Development Agency (CIDA). Canada provides funding and expertise in partnership with local governments and other development agencies. It is helping hundreds of millions of people in many countries around the world. Projects tend to focus on the ability of the nation to help itself, through economic and social development.
Task: Canadian initiatives in the developing world
Canada’s Global Affairs Department is responsible for distributing foreign aid. There are many types of foreign aid that may range from economic funding, resource allocation, or other types of support. To find out more about the various projects, go to the department’s website(Opens in new window).
Your task is to find one project and learn more about the partnership with the developing country and the impact of the initiative.
Try It!
To further your learning, answer the following questions in your notebook based on what you found out about Canadian initiatives in the developing world:
- What country received the foreign aid?
- Was the aid in the form of economic funding or resources, or both?
- Why did Canada provide this aid?

Part 1: Summarize your learning
You are at the end of this learning activity. Now is your chance to summarize your learning in your notebook.
Part 2: Connect your learning
Task: Research the population growth trends of another country
As you have seen in this learning activity, different populations around the globe are experiencing different growth rates, some being a positive rate (increase in population) and others with a negative rate (decrease in population). We may seem to understand the factors involved in growth of various populations, but we should rely on evidence from research to infer the reasons behind these trends.
- Research one (1) example for each type of growth rate (positive and negative).
- Be sure to choose a reputable, unbiased and accurate Internet source. This information should be relatively recent as well (e.g. within the last two (2) years).
Use the chart below to organize your research:
| Country with an increasing population trend: | |
|---|---|
| Web resource #1 | |
| Web resource #2 | |
| Population growth: | Positive or negative |
| List the factors involved in the population growth trend: | |
|---|---|
| Economic | |
| Social/cultural | |
| Environmental | |
| Political (e.g. government) | |
| Country with a decreasing population trend: | |
|---|---|
| Web resource #1 | |
| Web resource #2 | |
| Population growth: | Positive or negative |
| List the factors involved in the population growth trend: | |
Part 3: Reflect on your learning
Review
Now that you have completed this learning activity, reflect back on the success criteria.
- explain demographic changes that have occurred in the history of human population
- explain issues related to rapid human population growth in terms of the economic, social and the environmental impact
- identify a Canadian initiative in a developing country
Looking at your notes for this learning activity, are they complete? Do you have all the information you will need to study later on?
Take the time to review concepts you are unsure about before moving on.
Select your level of readiness for each criterion.
| Success criteria - I am able to: | Yes - confident I am able | Not yet - need to review the learning activity |
|---|---|---|
| Explain demographic changes that have occurred in the history of human population | ||
| Explain issues related to rapid human population growth in terms of the economic, social and the environmental impact | ||
| Identify and describe a Canadian initiative in a developing country |