
Case Study: Asthma Attack
Welcome to SNC4M. To set the stage for this course, you will start by investigating a case study. This case study looks at an 11 year old with asthma.
Throughout this course you will use case studies to help you put context into the material you are learning. At the end of each unit you will choose one of your case studies to polish up and present to the teacher for feedback. Your culminating task will involve finalizing a case study and presenting it in detail.
Read through the following case study. Answer as much of it as possible, completing research. If you get stuck on something and cannot find the answers, that is ok at this point. You will have time to revisit it and improve on it at the end of the learning activity. Try everything at this point. When you are complete, save your work.

You may choose to print off the case study to work on it.

Setting up a notebook
You will need a notebook for this course. You may choose to use a paper notebook and handwrite your notes. Or, you may choose to create a document on your computer word processing software. Consider carefully which works best for you. You should summarize new learning and add notes to the notebook at the end of each learning activity. It is important for learners to actively think and make connections when learning new content. This active thinking, note-taking and brainstorming while reading greatly increases success and comprehension.
A guided note-taking file has been created to help guide you through this course. You may choose to download and print the file, to take your notes in pen or pencil. Or, you may open the file and insert images and type your notes.
It’s important to note that throughout this course you will be asked to brainstorm ideas and make rough notes as part of the learning process. This should be done in a separate location (a notebook, loose paper or digital file). The guided note files will help you make your more formal notes on the major concepts introduced in this course.
Unit 1 Guided Note Taking Package (Opens in new window)
Before starting, be sure to have your Unit 1 guided notes package available (either printed or digitally) so that you can make notes on important concepts. The package will guide you on what to make notes about.
Primary vital signs
The four primary vital signs that are used to measure your physical health are:
- Heart rate
- Blood pressure
- Body temperature
- Lung capacity
You will learn about how each of these is measured and why they are important for regulating your overall health.
Homeostasis
The levels of these four primary vital signs are maintained by homeostasis. Homeostasis is the process by which a constant internal environment is maintained, despite changes in the external environment. For example, the human body’s optimum internal temperature is approximately 37°C. One way that your body maintains this temperature is through a homeostatic process that uses the evaporation of water (sweat) to cool your skin. This helps you to lower your body temperature when you begin to overheat. Homeostasis also occurs in the pancreas, where blood sugar is regulated. Too much or too little sugar in the blood causes the pancreas to secrete regulatory chemicals that help to keep blood sugar levels within a safe range.
Homeostatic processes depend on feedback systems (sometimes called “feedback loops”). There are two types of feedback systems used in homeostasis: negative and positive.
Negative feedback is the system by which a process is activated to restore conditions to their original state. This is the most common homeostatic process. One example is the thermostat on a furnace. If it gets too cold inside, the thermostat turns the furnace on automatically to heat up your room. If it is too hot inside, the thermostat shuts off (and the air conditioner may even turn on, in some cases). In this way, the temperature inside is kept within certain limits, determined by the thermostat setting. Many systems in your body, such as your heart rate, work in the same way. When you start to do vigorous exercise, your muscles need more oxygen, so a signal is sent to your brain to increase the heart rate in order to pump more blood to your muscles. Once you have stopped exercising, your need for extra oxygen decreases, so your brain sends a signal to your heart to make it slow down to its normal rate.

Positive feedback is the opposite of negative feedback. This is the process by which a small effect is amplified, in order to move the system even further away from its normal resting point. It is less common than negative feedback, but it can play an important role in systems that require a temporary push, in order to put them outside their normal operating range. An example of this is the human birth process:
- As the birth process starts, a decrease in the hormone progesterone causes small contractions in the uterus.
- These contractions trigger the release of the hormone oxytocin, which causes even stronger contractions.
- These contractions help to move the baby along the birth canal.
- When the baby’s head pushes on the cervix, it sends nerve signals to release even more oxytocin.
- Once birth has occurred, another hormone causes the positive feedback to end and the uterine contractions stop.

Checkpoint
Complete this quick self-assessment before continuing on.
| I can… | Yes! I’ve made notes on this, understand it and am good to continue on. | I missed something, I need to go back and review, make notes. |
|---|---|---|
|
List the four primary vital signs |
||
|
Describe the term “negative feedback” and give an example. |
||
|
Describe the term “positive feedback” and give an example |
Heart rate
Your heart beats over 100,000 times per day and averages between 60 and 100 beats per minute. Heart rate is affected by factors such as age, fitness level, and stress, among other things. An athlete may have a heart rate that is lower than 60 beats per minute, whereas children and babies tend to have heart rates that are over 100.
A specific region of your heart muscle, known as the pacemaker, sets the rate at which your heart beats. This bundle of specialized muscle tissue is called the sino-atrial (SA) node, and is located in the wall of the right atrium. It generates an electrical signal that spreads over the two upper chambers of the heart, the left and right atriums. As the atriums contract, the signal reaches another node, called the atrioventricular (AV) node. The impulse initiates the contraction of the bottom two chambers of the heart, the left and right ventricles.

Measuring heart rate
A stethoscope is a medical device used to listen to the sounds made when your heart beats. The doctor places the stethoscope against your chest near the heart, and as your heart beats, small vibrations are picked up on the small rubber diaphragm located in the bell- shaped part of the stethoscope. The sound from the vibrating diaphragm passes through the hollow tube to the stethoscope’s earpieces. A normal heart sound has a double beat, which is often described as a sound like “lub-DUB.” These sounds are made as different heart valves close. The first heart sound, “lub,” is the closing of the atrioventricular (AV) valves, as blood is pumped from the atria to the ventricles. The second sound, “DUB,” is the closing of the semilunar valves, as blood is pumped from the ventricles into the arteries.
You can also measure your heart rate using your middle and index finger on several places on the body. The carotid artery in your neck and radial artery in your wrist are the most common locations to detect a pulse. You will also need to time the number of “pulses” to get your heart rate per minute. You can time the number of pulses in one minute or count pulses for 30 seconds and multiply the number by two.
Did you know?
You cannot use your thumb to detect a pulse, as the thumb has its own pulse!

Image of measuring the pulse using the radial artery.
To obtain a better analysis of heart function, doctors measure electrical impulses generated by nerve signals, which stimulate contractions of the heart muscles. The electrical pulses that cause the heart to beat create small millivolt changes that can be measured by electrodes placed on the skin of the chest. These voltages are measured and produce a graph called an electrocardiogram (ECG), which physicians use to diagnose the health of the heart.

There are three phases of an ECG:
- P wave, begins when the SA node fires and the atriums contract.
- The next wave is called the QRS complex and this occurs when the AV node stimulates the ventricles to contract and the atrioventricular valve closes, producing the first sound, “lub.”
- The final wave of the cycle is the T wave, which occurs when the ventricles relax and the semilunar valves close, in order to produce the second heart sound, “DUB.” Relaxation of the ventricles is followed by the next firing of the SA node for the next heartbeat.


An ECG image produces the PQRST wave that helps the physician determine whether a patient’s heart is generating signals with a normal frequency, strength, and duration.
An ECG image, like the example shown, depicts the pattern of repeated PQRST waves that helps physicians determine whether a patient’s heart is generating signals with a normal strength, frequency, and duration. The height of the pulses on the graph indicates strength; the number of PQRST waves per minute indicates frequency; and the time it takes to complete one PQRST wave indicates duration.
Did you know?
On July 26, 2019 Apple released an update for the most recent Apple Watches in Canada. This allowed the ECG function to work in Canada. It took Apple longer to release this function in countries other than the USA, while they worked with the health regulations in each different country. If you happen to know anyone with an Apple Watch that has the ECG function, it might be interesting to explore the readouts given by these apps.
Review
For more information, perform your own research on the ECG function on Apple watches in Canada.
Blood Pressure
As blood passes through the blood vessels in your body, it exerts pressure against the vessel walls. This is called blood pressure, and it changes according to the phases of your heartbeat. As your heart rate increases—for example, during exercise—the ventricles pump a greater volume of blood per minute, so your arterial pressure increases. Blood pressure is affected by genetics, activity, stress, body temperature, age, diet, and medications. For example, it is normal for your blood pressure to increase while you are exercising and decrease while you are sleeping.
Measuring blood pressure
Blood pressure is measured using a sphygmomanometer.
A sphygmomanometer is commonly known as a blood-pressure cuff, because it has a cuff (tight band) that is wrapped around the upper arm. This is inflated to exert pressure on a large artery in the arm. Eventually, the pressure from the cuff is high enough to temporarily stop the blood flow in the artery. The user listens for this stoppage through the ear pieces. Then, the air is slowly let out of the cuff, until the pressure in the cuff is low enough to allow blood to begin to flow again. The user listens for the sound of the blood starting to reflow. The pressure when the blood stops is recorded, along with the pressure when the blood starts to reflow.
The measurement of blood pressure is made in millimetres of mercury (mm Hg), which is a standard unit of liquid pressure. The measurement is represented by two numbers, such as 120/80. The first number is called the systolic pressure, which is the highest recorded pressure in an artery when the ventricles contract and force the blood into the pulmonary arteries and the aorta. The second number represents the diastolic pressure, which is the lowest recorded pressure in an artery during the relaxation phase of the heartbeat. The blood pressure of a healthy adult is around 120/80 (mm Hg).
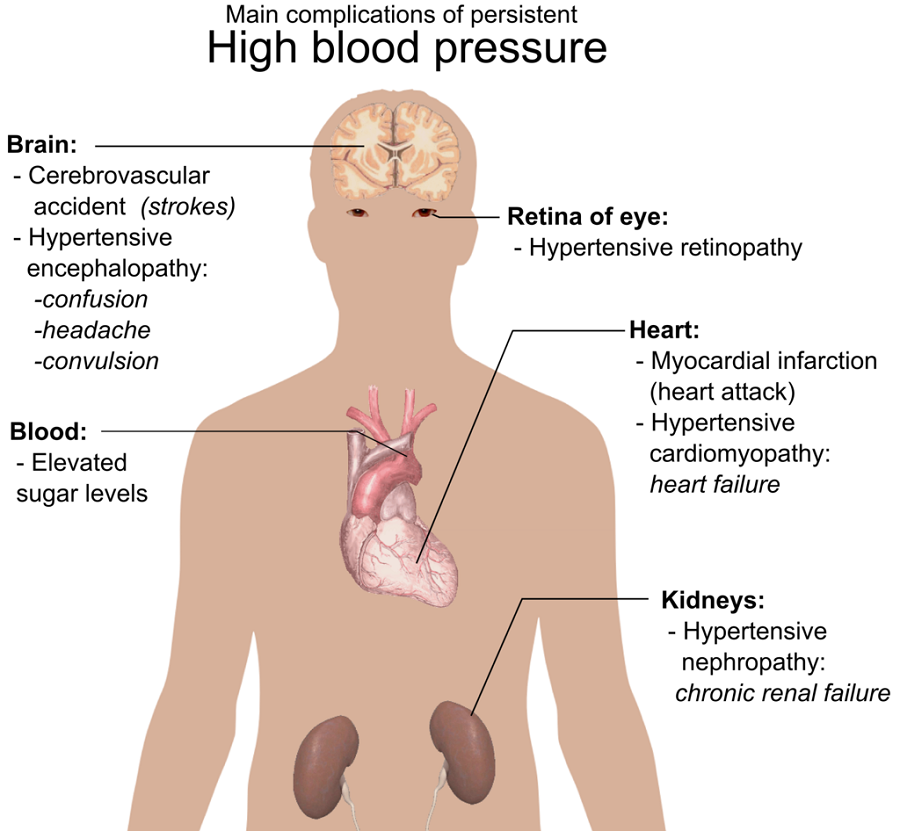
Continuous high blood pressure, called hypertension, can cause your heart to work harder for extended periods. This increases the risk of damage to arteries and the risk of heart attacks, stroke, and kidney failure. Heavy smokers tend to have high blood pressure because vasoconstriction (narrowing of the arteries) increases blood pressure. This is because a constricted vessel is much more resistant to blood flow. This leads to a buildup of pressure in the vessels, much like when you squeeze a hose while water is running through it.
Continuous low blood pressure is called hypotension, and can also be dangerous to your health. If blood pressure stays too low, fainting, or even seizures, may occur. Hypotension can be the result of dehydration from illnesses that cause you to lose fluid through vomiting and diarrhea.
Interpreting blood-pressure data
Blood pressure changes over the course of your life. It changes as you age and as your fitness level changes. The figure shows blood pressure readings taken from a person every five years, from age 10 to age 60. This person did not exercise regularly and ate foods that were high in fat.

Checkpoint
Complete this quick self-assessment before continuing on.
| I can… | Yes! I’ve made notes on this, understand it and am good to continue on. | I missed something, I need to go back to review and make notes. |
|---|---|---|
|
Explain how the heart beats |
||
|
Describe how an ECG is used to measure heart rate |
||
|
Analyse an ECG readout |
||
|
Explain what blood pressure is |
||
|
Describe how to measure blood pressure |
||
|
Explain the hazards associated with high blood pressure |
||
|
Interpret blood pressure data |
||
|
Use terminology such as hypotension and hypertension |
Body temperature
Temperature control, called thermoregulation, is part of a homeostatic process that keeps your body at an optimum temperature. This is important, because temperature affects your metabolism and overall well-being. The ability to generate and regulate internal body temperature declines with age. For example, children develop high temperatures during activities like playing, but their temperature quickly returns to normal when they stop. The elderly, however, often have difficulty generating enough heat, especially when they are sick with a fever. The body generates heat mainly from the metabolism in large organs like the kidneys and liver, but can also do so from the contractions of muscles. One of your first reactions to feeling cold is to shiver, which is caused by the rapid contraction of large muscles in your body to generate heat.
Measuring body temperature
Temperature is measured using a thermometer. There are many types of thermometers and places on the body to get a reading, such as digital oral thermometers, rectal thermometers, ear thermometers and forehead thermometers.
The average oral temperature is 36.8 °C. This can vary among individuals, as well as within an individual throughout the day. Normal body temperature may differ as much as 0.6 °C between individuals, or from day to day within the same individual. Generally, the lowest body temperature occurs about two hours before waking. Your temperature increases after eating, and psychological factors also influence body temperature. For an oral temperature reading to be accurate, the person must not have eaten, drunk, or smoked anything during the 15 to 20 minutes before their temperature is taken. This is because the temperature of the food, drink, or smoke can dramatically affect the reading taken from the mouth.
Lung capacity
Take a deep breath. Does it feel different from your normal breathing? Think about some physical activity that you have done recently. Did you run out of breath? Your breathing during physical activity is more pronounced than it is under normal conditions. Under normal circumstances, you do not use the full capacity of your lungs when you breathe. So, when your body needs more oxygen, the volume of air that is drawn into your lungs can increase.
Measuring lung capacity
Your lung capacity is measured using a device called a spirometer.
The spirometer measures the volume of air expelled by your lungs. You blow into the device at various points in your breathing cycle to measure the different volumes of air being moved in and out. The graph shown is called a spirograph, and it represents the amount of air that moves into and out of your lungs with each breath. The terms used to describe the features of a spirograph are explained below:

Factors affecting lung capacity
Lung capacity varies between individuals and within individuals, over time. Athletes have higher vital capacities than non-athletes, partly because regular vigorous exercise increases vital capacity. A non-athletic individual can significantly increase their vital capacity if they start exercising, although they may never achieve the level of some elite athletes who were born with naturally high vital capacities. Vital capacity will also differ among individuals due to sex, age, and height. The following table shows how much variation there is in vital capacity due to these three factors.
| Height (cm) | Men (Volume measured in litres) |
||||||||
|---|---|---|---|---|---|---|---|---|---|
| Age | 10 | 20 | 30 | 40 | 50 | 60 | 70 | 80 | |
| 122 | 1.48 | 2.48 | 2.35 | 2.17 | 1.94 | 1.65 | 1.30 | 0.91 | |
| 145 | 2.62 | 3.62 | 3.49 | 3.31 | 3.07 | 2.78 | 2.44 | 2.04 | |
| 175 | 4.44 | 5.44 | 5.31 | 5.13 | 4.89 | 4.60 | 4.26 | 3.86 | |
| Women (Volume measured in litres) |
|||||||||
| Age | 10 | 20 | 30 | 40 | 50 | 60 | 70 | 80 | |
| 122 | 1.59 | 2.07 | 2.06 | 1.98 | 1.83 | 1.59 | 1.28 | 0.90 | |
| 145 | 2.49 | 2.97 | 2.97 | 2.89 | 2.73 | 2.50 | 2.19 | 1.80 | |
| 175 | 3.93 | 4.42 | 4.41 | 4.33 | 4.17 | 3.94 | 3.63 | 3.25 | |
Vital capacity is also affected by disease. Medical conditions that reduce vital capacity include cystic fibrosis, asthma, and a history of smoking. Pneumonia and recent heart surgery would also lead to a reduced volume of lung capacity. One disease that dramatically reduces vital capacity is commonly called COPD. This is an acronym for chronic obstructive pulmonary disease. This disease includes medical conditions such as bronchitis and emphysema, where inspiratory reserve volume is reduced. The volume of air expelled is normal, but the air-flow rate is slower, so the time that it takes to inhale and exhale a deep breath takes longer. This would change the shape of the spirograph by stretching out the curves along the x-axis.
Statistics show that over 57% of people diagnosed with COPD are women, and that part of the reason for this is smoking. In fact, because the incidence of smoking is declining in men, the number of men with COPD is dropping, while the number of women with the disease is increasing, since their smoking rates have not declined as much. According to Canada’s Public Health Agency, 4.8% of women over 35 suffer from COPD, compared to 4.3% of men.
The health impacts of COPD are serious. According to the Canadian Lung Association, since 2000, female mortality due to COPD has been double the rate of female mortality due to breast cancer. The impact of COPD on women is generally higher than it is on men. This is because women use a greater proportion of their lungs than men for regular breathing. This means that it takes more effort for them to breathe and increases their shortness of breath (SOB), even if there are minor obstructions to breathing, such as a slight cold. Overall, because of their smaller bodies and airways, and their need for relatively more oxygen, women with COPD will experience more symptoms than men who are at the same stage of the disease.
Checkpoint
Complete this quick self-assessment before continuing on.
| I can… | Yes! I’ve made notes on this, understand it and am good to continue on. | I missed something, I need to go back to review and make notes |
|---|---|---|
|
Describe why measuring body temperature is important |
||
|
Explain how to measure body temperature |
||
|
State the normal values for body temperature |
||
|
Explain what lung capacity is |
||
|
Describe how to measure lung capacity using terms such as sphygmomanometer, vital capacity, tidal volume, reserve volume and residual volume |
||
|
Explain factors that impact lung capacity |
Cardiac output and stroke volume
Cardiovascular fitness is the capacity of your heart, lungs, and blood pressure (three of the four primary vital signs) to deliver oxygen to your muscles so that you can sustain physical activity. Cardiac output and stroke volume are indicators that can determine your cardiovascular fitness. Cardiac output is an indicator of the level of oxygen delivered to the body; therefore, it refers to the total level of work that your body’s muscles can perform. The factors that contribute to cardiac output are your heart rate (which was covered earlier) and stroke volume. Stroke volume is the amount of blood forced out of the heart with each heartbeat.
Cardiac output = heart rate × stroke volume
Stroke volume is dependent on how easily the heart fills with blood. This depends on the condition of your blood vessels, and on how the blood is emptied from your heart, which relates to the strength of ventricular contraction and the pressure exerted on artery walls. The average person has a stroke volume of 70 mL and a resting heart rate of 70 beats per minute. Therefore, the cardiac output for an average adult is 4,900 mL/min (70 × 70). An average adult has five litres of blood in their circulatory system; therefore, with a cardiac output of 4,900 mL/min, this entire volume of blood is passing through your heart once every minute.
Cardiovascular exercises, such as running, provide health benefits by enlarging your ventricles, increasing their elasticity, and strengthening the ventricle walls. These changes produce an increase in stroke volume. A good indicator of cardiovascular fitness is the length of time it takes the heart to recover to its resting heart rate after strenuous exercise. The more fit the heart is, the quicker it will take to recover and return to its resting heart rate. More men than women currently have heart disease, at every age, but women are catching up to men in their risk of developing the disease. By age 60, on average, women have as many coronary risk factors—such as hypertension, high cholesterol, and excess weight—as men, and after age 60, they have more. Less than two decades ago, women didn’t catch up to men until age 70. The reason for this decline in women’s health is partly explained by the increase in the percentage of women who took up smoking during the 1960s and 70s.
Analyzing cardiac output and stroke volume
One way to assess the cardiovascular fitness of an individual is to calculate their cardiac output and determine how efficiently they are pumping blood. A fitter individual will have a higher stroke volume, and so will be able to pump the same volume of blood using fewer heart beats per minute. Examine the three scenarios provided in the following table.
| Individual | Resting heart rate (beats/min) | Stroke volume (mL/beat) | Cardiac output (mL/min) |
|---|---|---|---|
| Mr. Gupta | 70 | 70 | 4,900 |
| Mr. Leavoy | 98 | 50 | 4,900 |
| Mr. Farmer | 35 | 140 | 4,900 |
Notice that each individual has the same cardiac output of 4,900 mL/min, but they differ in the resting heart rate and stroke volume. Mr. Gupta has an average heart rate and stroke volume. Mr. Leavoy has a higher-than-average resting heart rate and lower-than-average stroke volume. Mr. Farmer is the opposite, with a lower-than-average resting heart rate and a higher-than- average stroke volume.
Now that you have explored all the primary vital signs, think back to the concept of homeostasis. In your notes, create a table like the one here to make notes of the “normal values” or ranges for each vital sign.
| Vital Sign | Normal Value or Normal Range |
|---|---|
|
Heart Rate |
|
|
Blood Pressure |
|
|
Body Temperature |
|
|
Lung Capacity |
|
|
Resting Heart Rate |
|
|
Cardiac Output |
|
|
Stroke Volume |
Checkpoint
Complete this quick self-assessment before continuing on.
| I can… | Yes! I’ve made notes on this, understand it and am good to continue on. | I missed something, I need to go back to review and make notes. |
|---|---|---|
|
Compare and describe the relationship between resting heart rate, cardiac output and stroke volume |
||
|
Analyse data about cardiac output and stroke volume and make generalized conclusions about the person’s heart health |
||
|
State the normal values for heart rate, blood pressure, body temperature, lung capacity, resting heart rate, cardiac output and stroke volume |

Case study: asthma attack
Now that you have studied the major vital signs and how to measure them, review your work on the case study. How does your new understanding help you improve your research and answers to the case study? Review your work and add as much detail as you can.