Take a moment and breathe. That’s right, just stop what you’re doing and breathe in and breathe out. Think about the physiological processes involved in breathing. Think about the health and environmental impacts of being able to take a breath. This is where you will begin your environmental science course, by exploring the very air you breathe.
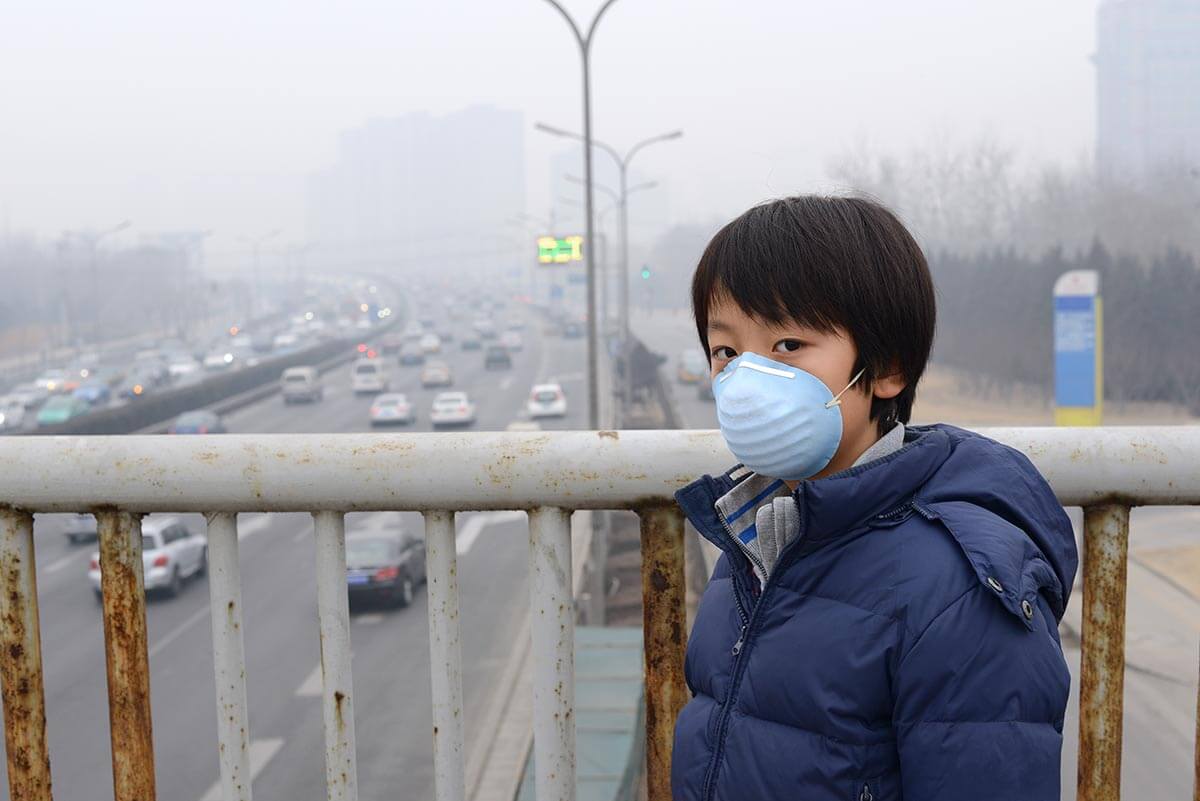
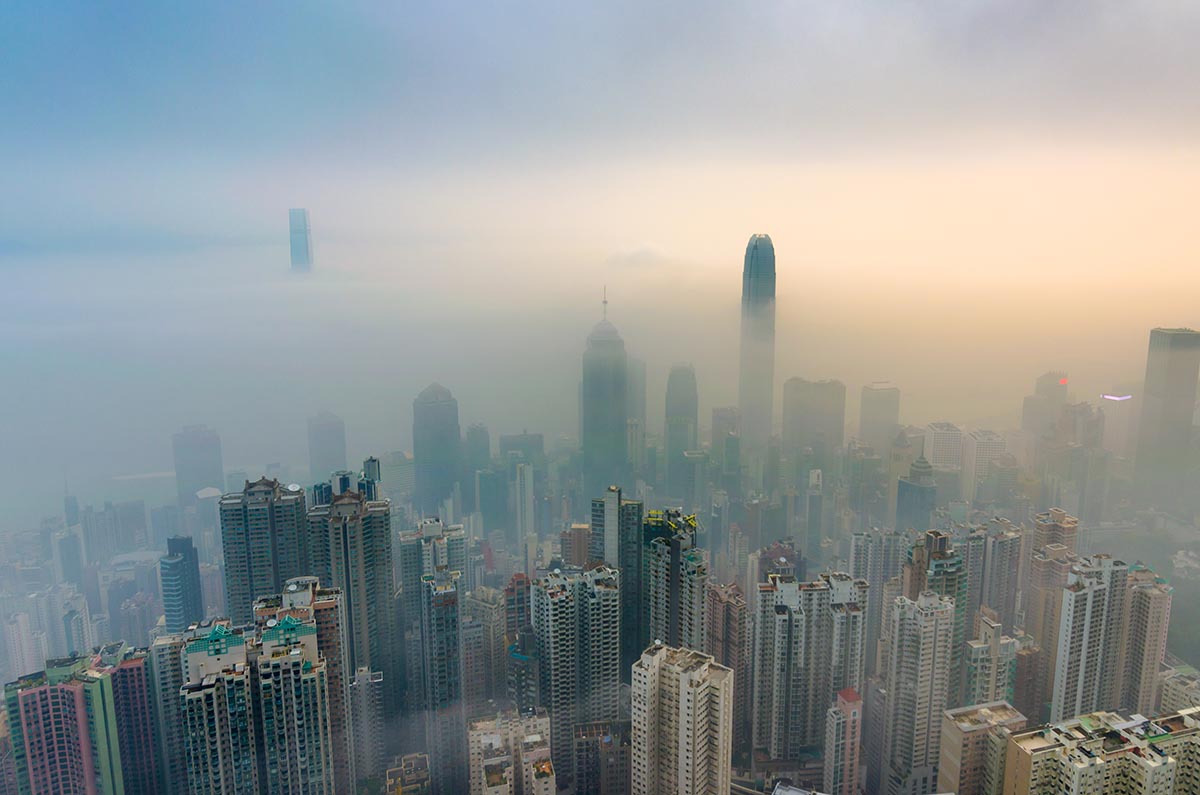
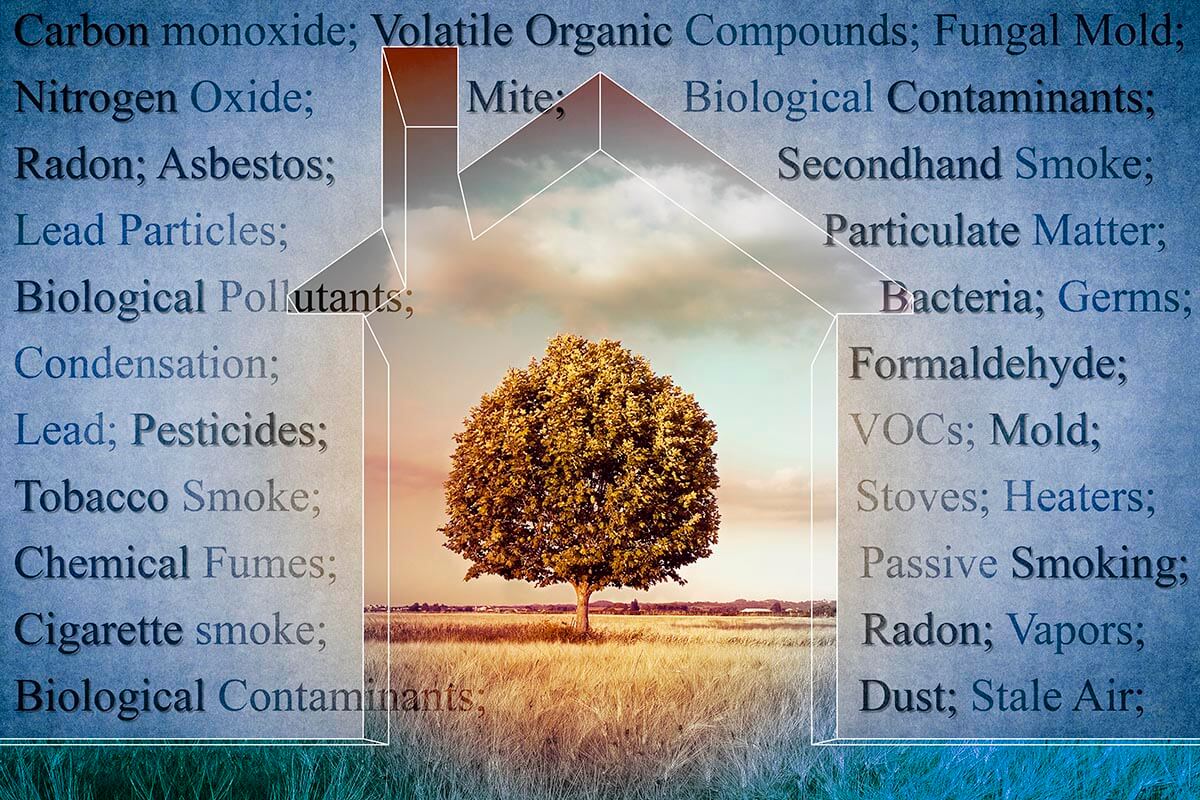
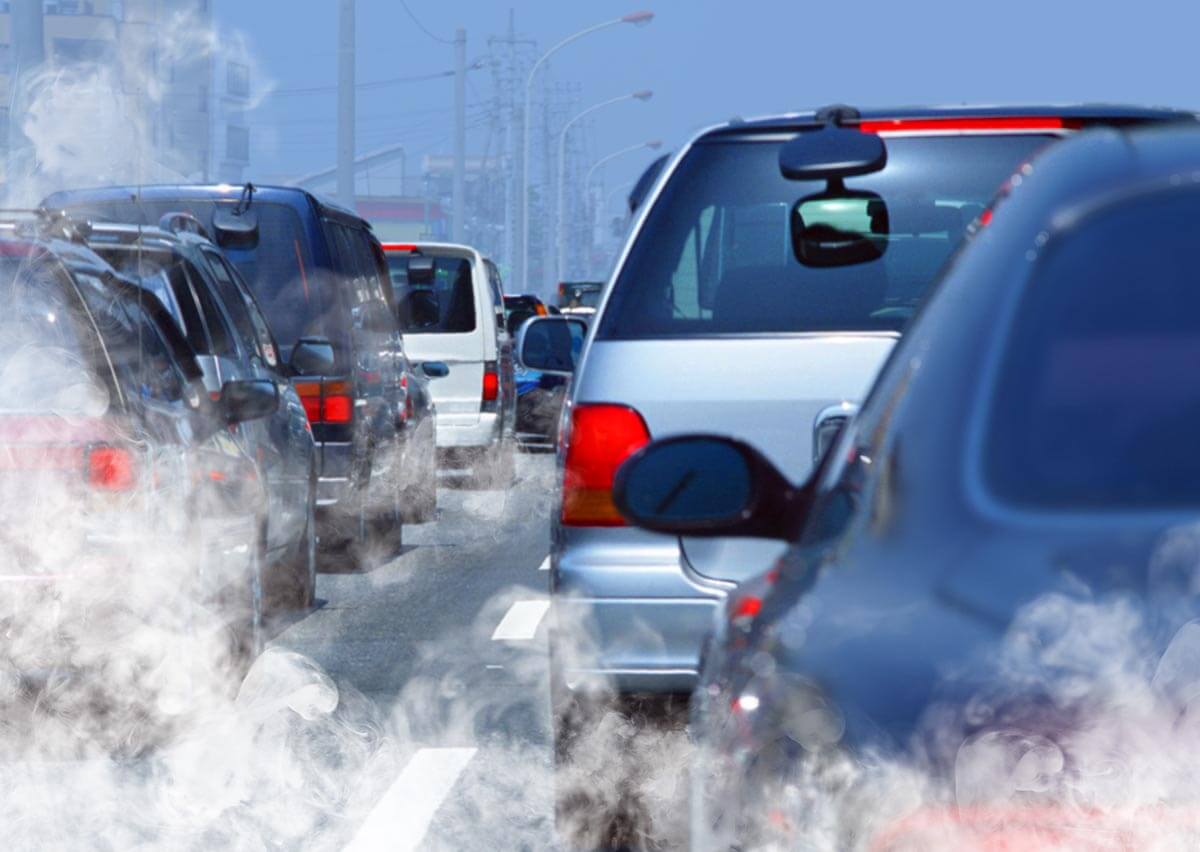
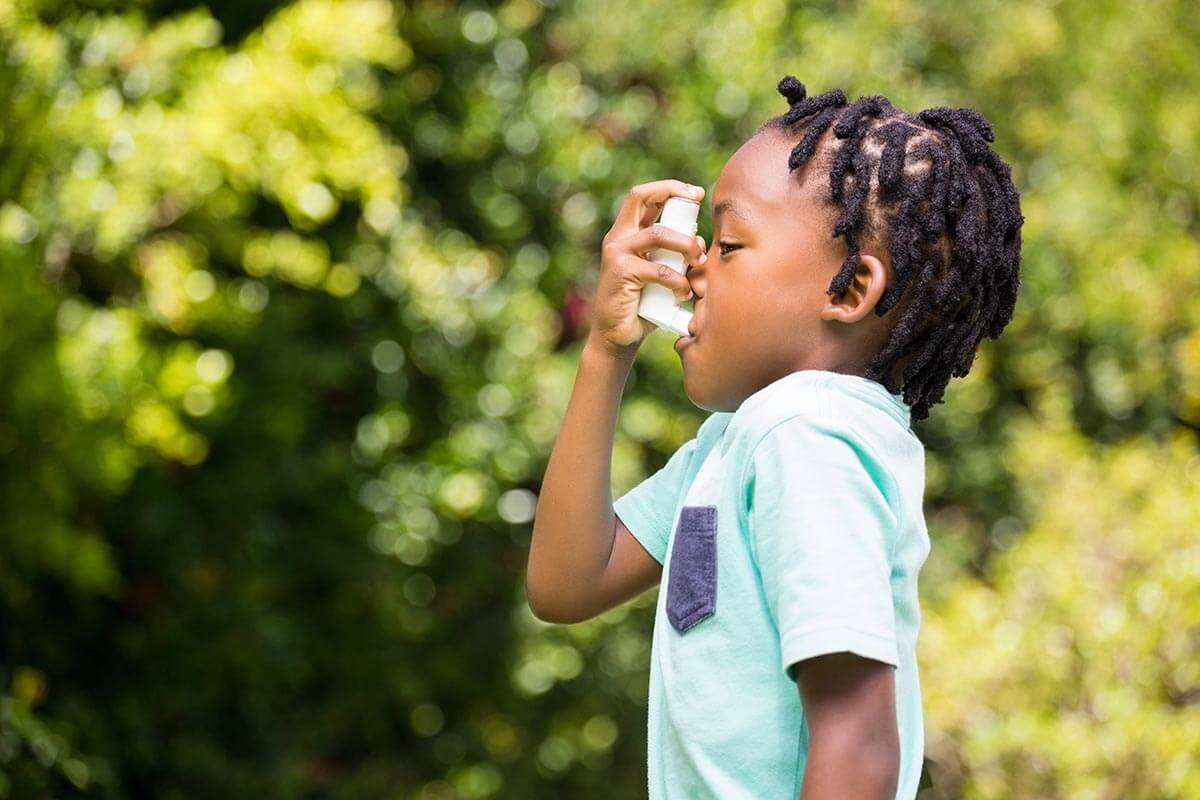
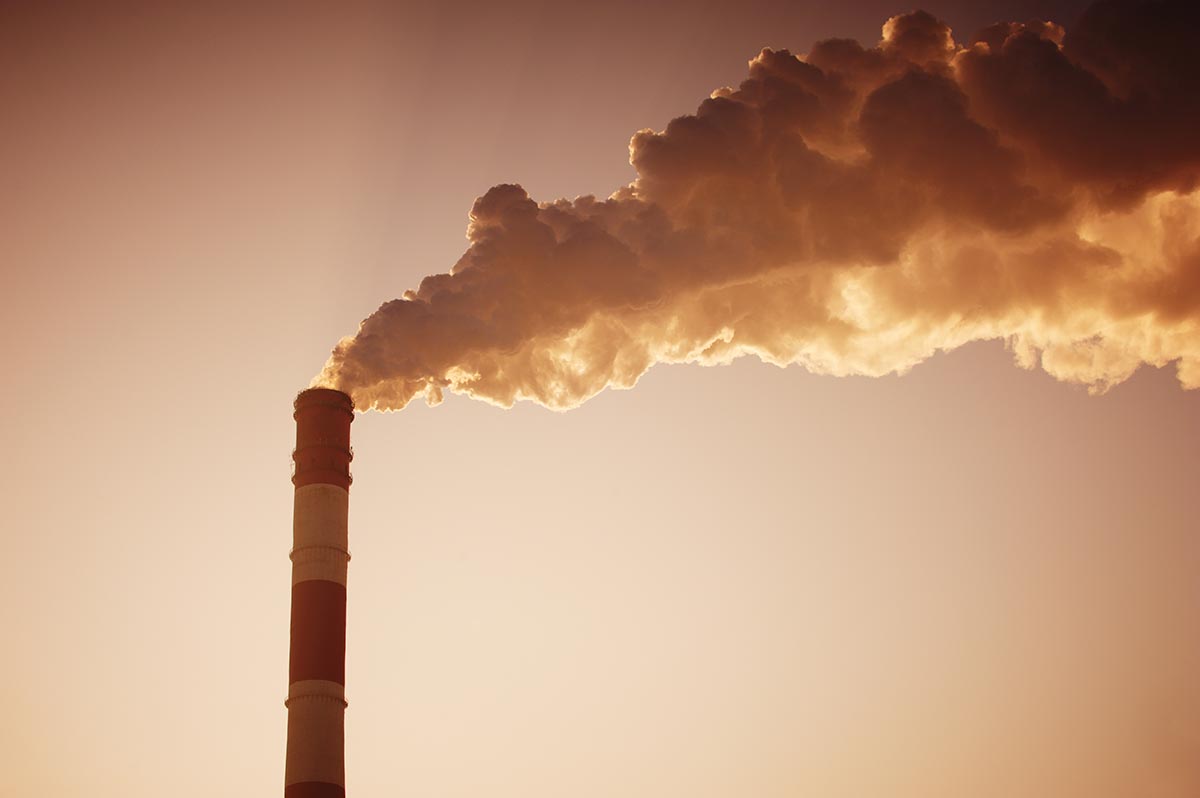
Consider these eight images in the slide show.
Notebook
It is recommended that you have a dedicated notebook for this course. As you work your way through the activities, you will be prompted to be active in your learning. You may be asked to complete activities, conduct research, read, watch and listen to different perspectives or answer questions and generate ideas. Keeping a notebook, either digital or paper based, will help you stay organized and keep track of your learning.
Here is your first notebook task.
- Answer at least two questions with examples from your own life.
- What main ideas are the images trying to demonstrate?
- Have you ever been witness to some of the situations in the images? How were you affected by them?
- Do you worry about any of the conditions depicted in the images? Explain.
- Do you know of any improvements that have been or are being made to improve these situations?
Create a list of the factors in the images that could potentially cause health issues in humans.

Air quality
Before starting this learning activity, take a few moments to look out your window.
What does the air look like?
Air should be colourless and transparent. You shouldn’t see it. Unfortunately, that’s not always the case. Pollutants in the air make it visible. So depending on where you live, the time of day, or the time of year, you might be able to see the air you breathe.
Now open a door or window. Smell the air. Air should have no odour. You shouldn’t be able to smell clean air any more than you can see it. But once again, pollutants can give air an odour.
Air is a mixture of gases. Most of the air is made up of two gases, nitrogen and oxygen. These two gases represent close to 99% of air. Nitrogen gas is not overly reactive. Animals can’t make use of it and plants can only use it if it’s been converted to nitrates through the nitrogen cycle. However, oxygen is important to the survival of humans and every other animal on Earth.
If oxygen and nitrogen make up 99% of our air, what about the remaining 1%? What’s in it?
Some of the gases are there naturally. These gases include argon, water vapour, and carbon dioxide. But other gases have ended up in the air as a result of human activities. These are pollutants, the gases that are measured and reported by the Air Quality Health Index or AQHI in Canada. Other countries have different air quality standards. For example, in Singapore air quality is measured and reported by the Pollutant Standards Index (PSI).
Air Quality Health Index
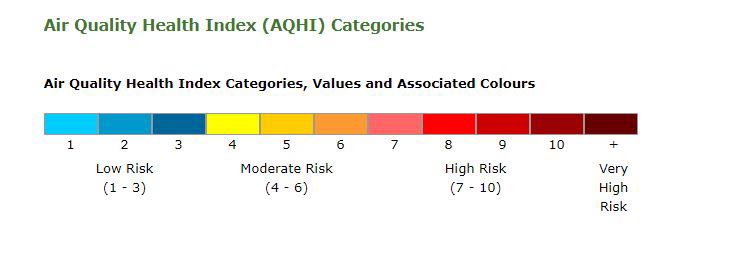
You may have come across reports on the Air Quality Health Index (AQHI) when watching or listening to the weather forecast. The AQHI is a standard measure of outdoor air quality in Canada. Air quality is measured in terms of the quantity of certain pollutants in the air.
You may already know that the AQHI is a number, and the higher the number the worse the quality of the air. But what do the numbers tell you? And what pollutants are being measured?
Discover more
Review the AQHI for various cities within Canada (Opens in new window). This link is provided as a suggestion. You are encouraged to use the internet to learn more about the air quality index for where you live.
Air quality monitoring
The Ontario Ministry of the Environment is responsible for monitoring and reporting on air quality. The ministry operates air monitoring stations throughout the province. These stations are indicated on an interactive online map. (Opens in new window)
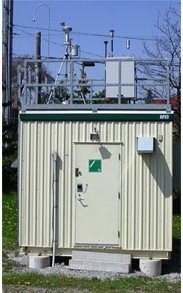
This site provides hourly readings on air quality in or near your community. By navigating through the site, you can find out the exact location of the monitoring station nearest you, including a photograph. You may even have passed by the station and wondered what it was. All the contaminants measured at the station are listed, along with their most recent concentrations.
If you live in Ontario, take the time to visit this website or explore to find similar information for your local community. This information is especially useful if you, family members, or friends suffer from asthma or other respiratory ailments. Air pollutants, especially ozone and fine particulate matter, can harm the health of people with these conditions. Those who are vulnerable to air pollutants should check the AQHI daily; especially from May to October, the peak months for ozone production, and refrain from strenuous outdoor activity when the AQHI is high.
Here is a screen shot taken from the interactive online map on January 22, 2020 at 2pm showing the air quality readings from all of the stations in Ontario.
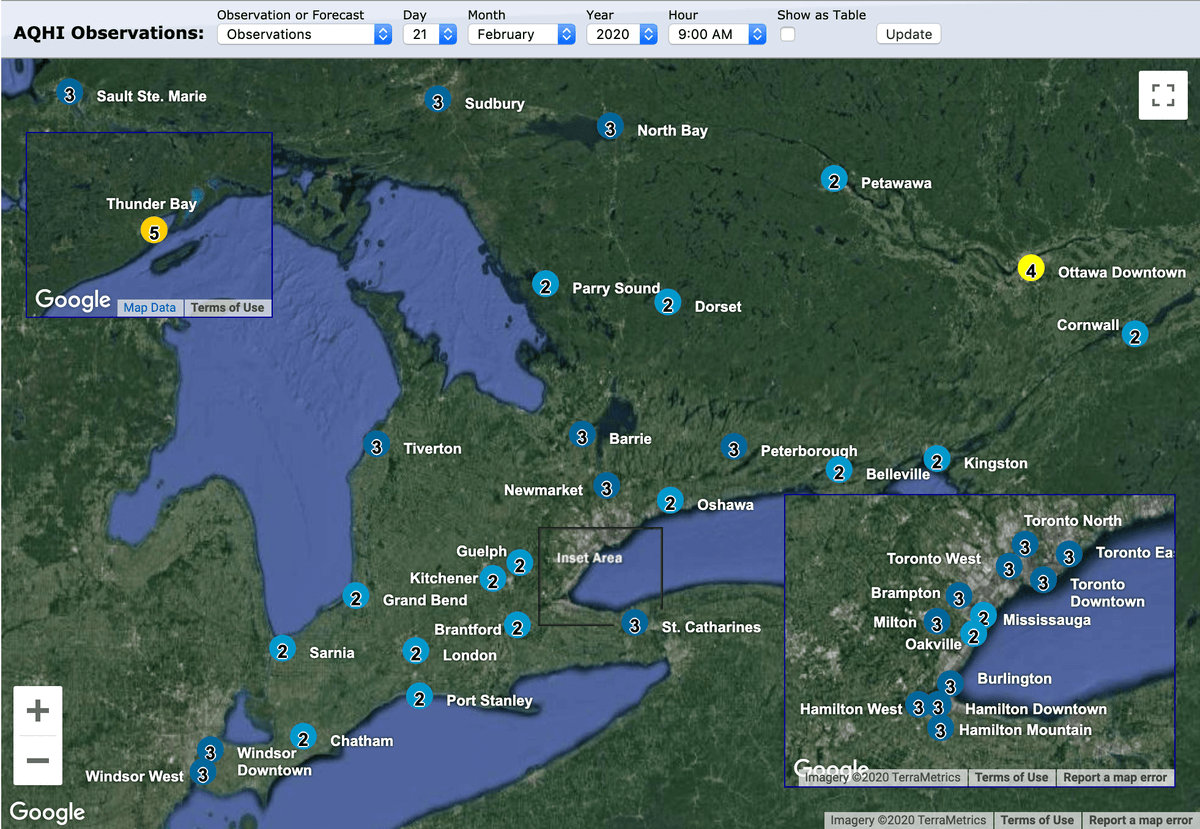
Notice where in the province most stations are located. As you can see, there is a cluster of stations near the city of Toronto. The remaining stations are spread throughout the rest of the province; many of them are found in the province’s larger cities.
Select each of the following pollutants to learn more about how they affect air quality.
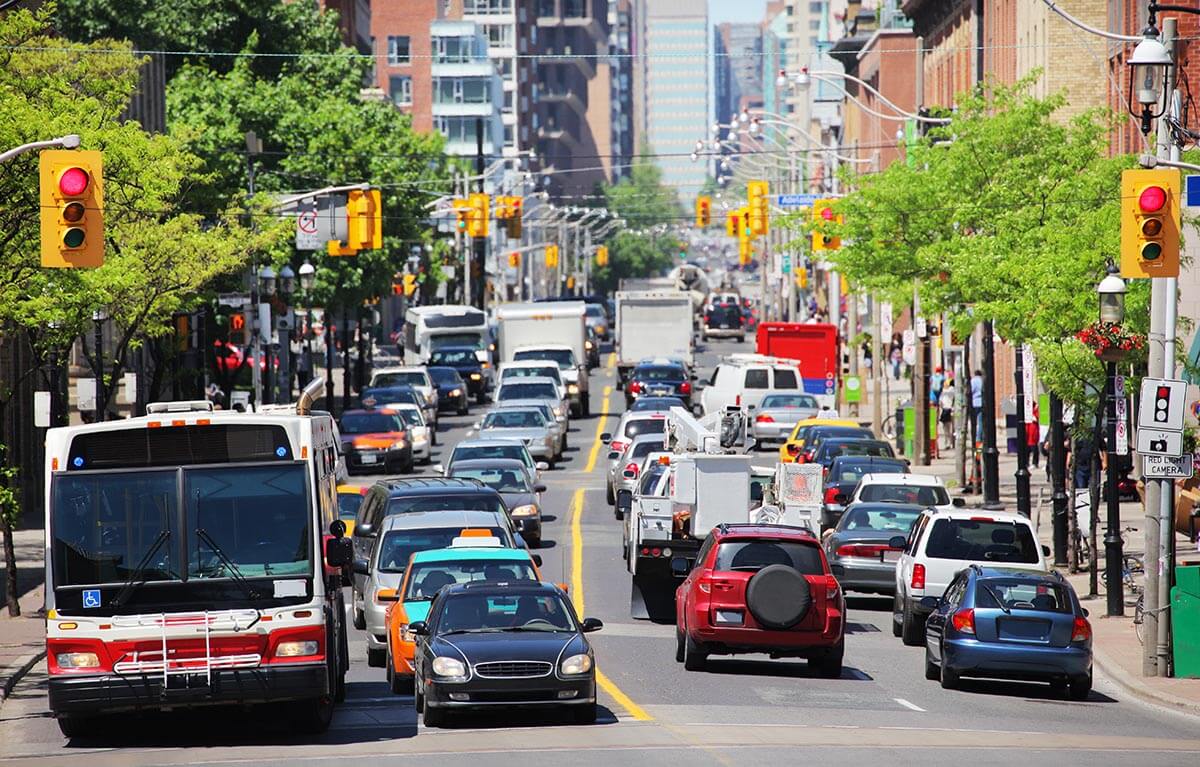
Ozone is a colourless, odourless gas. Ozone is not released directly into the atmosphere. It results from a chemical reaction between nitrogen dioxide (NO2) and vapours from organic compounds (VOCs). Sunlight provides the energy for this chemical reaction, and the end product is ozone. In Canada, ozone is mostly produced in the summer. Transportation (cars, buses, trucks, trains, and airplanes) is responsible for most of the ozone that pollutes the air.
You may be familiar with the ozone in the stratosphere that blocks UV radiation from the sun. Other ozone is described as ground level. This is the same chemical, but in a different location. Ground-level ozone affects the eyes and respiratory system, and can cause tightness in the chest, difficulty breathing, coughing, and wheezing. Once ozone is in your lungs, it remains there for a period of time and continues to cause damage. It also damages plants.

Volatile organic compounds (VOCs) are carbon-based compounds that evaporate very easily. When heated just slightly, these chemicals end up in the air. The warmer the day, the more VOCs will evaporate and end up in the air. Many solvents, substances that are used to dissolve other chemicals, and lubricants are VOCs. Oil-based paint is another example of a VOC. When using oil-based paints, you are very aware of the odour. Oil-based paints are rarely used in homes anymore; if they are used, it is usually for the exterior.
Fine particulate matter is one of the pollutants that makes air visible when air quality is poor. These particles result from a number of human activities; driving cars and other vehicles, the combustion of any kind of fuel, smelting of metal ores, and the production of paper.
Fine particulate matter is classified according to the diameter of the particles in micrometres. One micrometre (μm) is one millionth of a metre. PM2.5 means that the particle is small enough to penetrate deep into the lungs. Anything larger will likely be trapped in the mucus and cilia that line your airways. Examples of PM2.5 particulate matter in the air include sulphates and nitrates, ash, smoke, chemical fumes, dust, and pollen. When these smaller particles travel deep into your lungs, they can trigger asthma attacks and cause lung and cardiovascular diseases.
Long-term exposure to fine particulate matter can increase your chances of lung cancer or premature death.

Nitrogen dioxide is a reddish-brown gas with a sharp, biting odour. It is one of the pollutants responsible for the colour of poor quality air as well as its odour. Nitrogen dioxide can change into nitrates, a type of fine particulate matter. Nitrogen oxides result from the combustion of various kinds of fuel, especially those used in different forms of transportation. Nitrogen dioxide dissolves in the moisture inside the airways and lungs to form nitric acid. This irritates the respiratory tissues and lowers your resistance to diseases.
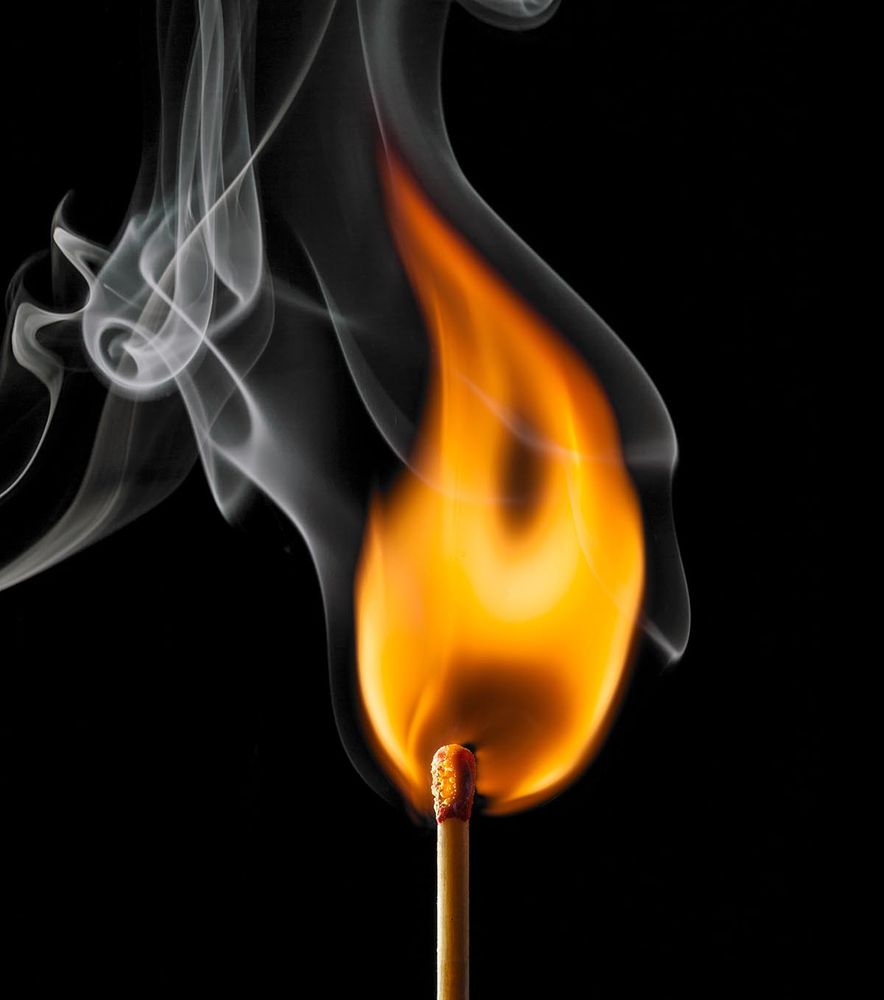
Sulphur dioxide is a colourless gas that has the odour of burning matches. This gas also contributes to the odour of poor quality air. It usually ends up in the air when metal ores are smelted (refined) into purer forms. Many metal ores contain sulphur impurities. Like nitrogen dioxide, sulphur dioxide can combine with moisture to form acids in the lungs. This will irritate the lungs and lower disease resistance.
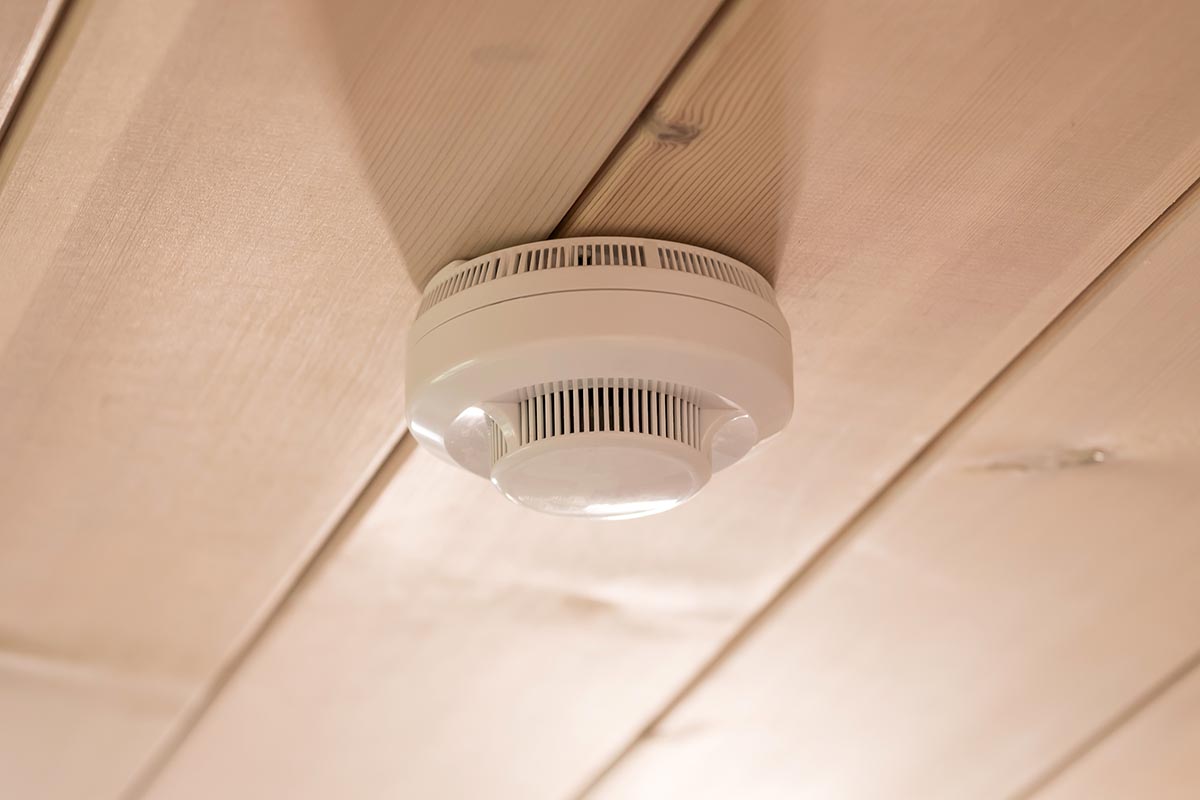
Carbon monoxide is an odourless, colourless, tasteless but very poisonous gas. It results from the combustion of fuels with less than the optimal amount of oxygen. It is usually associated with vehicles, but also forms in dirty, poorly maintained furnaces and fireplaces. That is why most homeowners have installed carbon monoxide detectors along with their smoke detectors.
Normally in your blood, oxygen combines with hemoglobin, but when carbon monoxide enters the bloodstream, it combines with hemoglobin in place of oxygen. Cells don’t receive enough oxygen for cellular respiration and the body cannot function properly. High concentrations of carbon monoxide over extended time periods can cause death.
Notebook
In your notes, describe each of the air pollutants listed. Indicate where each comes from, as well as what impact it has on human health. You may wish to use a table like the one shown. The information about fine particulate matter has been summarized as an example.
| Fine particulate matter | Ozone | VOCs | Nitrogen dioxide | Sulfur dioxide | Carbon monoxide | |
|---|---|---|---|---|---|---|
| What is it? |
|
|||||
| Sources |
|
|||||
| Health effects |
|
Smog
The word smog was probably created 100 years ago in England by combining the words smoke and fog. That’s what smog consisted of at the time. Nowadays smog is different, but the word has stuck around.
The smog that pollutes the air today is called photochemical smog because of the role sunlight plays in creating ozone from VOCs and nitrogen dioxide. Photo comes from the Greek word for light. Smog is a combination of ground-level ozone and fine particulate matter. Photochemical smog is the result of increased urbanization, industrialization, and vehicular transportation.
Sources of smog
Much of Ontario’s smog is carried by the wind from the United States, but there are local sources as well. Similarly, wind can carry smog into rural areas far away from the cities where smog is produced.
High levels of smog generally occur during the summer months on hot, sunny days and are highest between noon and early evening. During the rest of the day and the rest of the year, the level of ozone, and therefore smog, is lower. However, fine particulate matter can be present throughout the year, especially when there is little wind to disperse the particles.
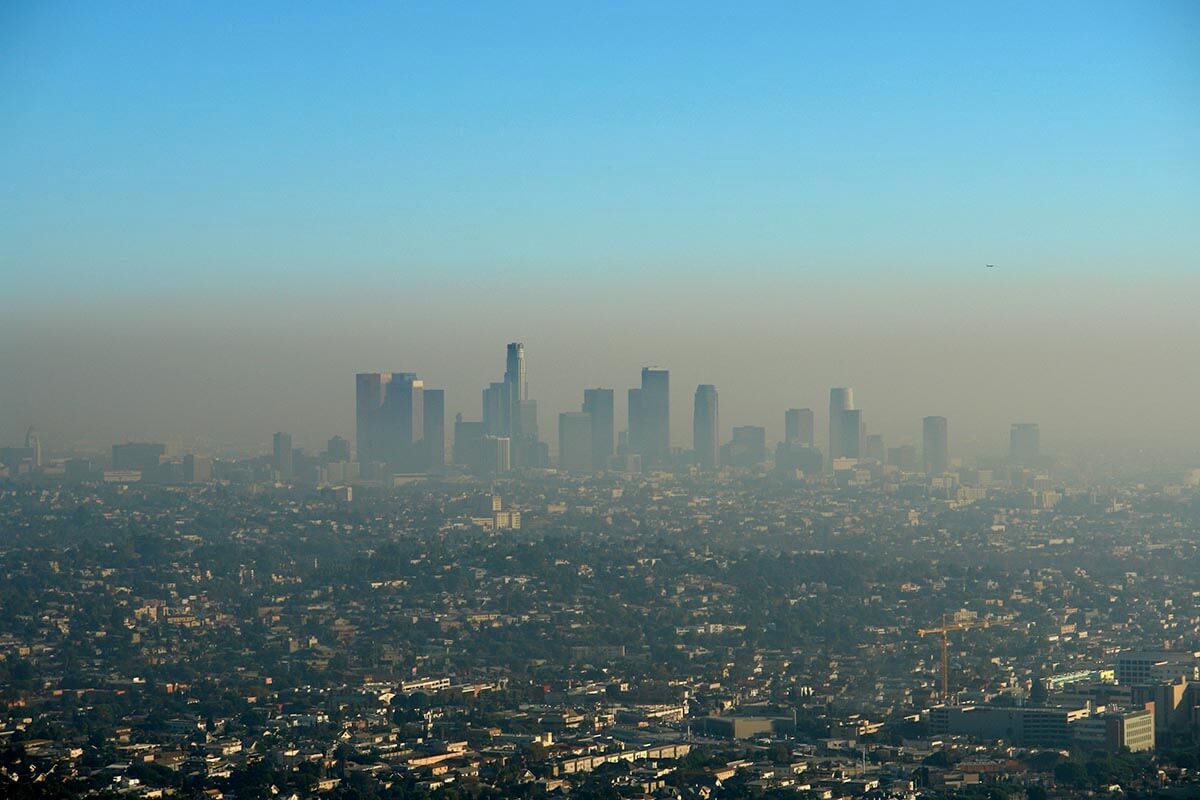
Geography can influence the severity of smog. Cities or regions that are located in bowls i.e. surrounded by hills and mountains, often experience extended days of smog. The air is physically trapped in the city by these landforms. Warm air above these cities, along with the landscape features that create the bowl, trap cool, dirty air below. This is called a temperature inversion. The smog cannot rise and be diluted or dispersed away from the city. Both Los Angeles and Mexico City are located in bowls and experience temperature inversions.
Even if a city is not located in a bowl, it can still experience a temperature inversion. The warm air above stops normal air circulation by convection. Examples include Toronto and Beijing. It is not unusual for these cities to have several days of smog in a row. You may remember seeing photos of smog at the beginning of this learning activity.
Health effects of smog
One of the worst recorded incidents of smog happened in London, England, during December of 1952. For four days, windless conditions created a temperature inversion, trapping cooler, smoggy air. Four thousand people died during the four-day period, with another 8,000 dying in the weeks that followed. In total, it was estimated that more than 100,000 people became ill because of the poor air quality.
This is an extreme example of the destructive effects of smog. The level of harm caused by smog depends on several factors:
- your age and general health,
- where you live,
- the levels and types of pollutants you are exposed to, and
- the length of your exposure.
People who already suffer from heart and lung diseases are most at risk. Seniors are more likely to have these conditions and so are more susceptible to the effects of smog. Children are also at risk; they are often active outdoors and their respiratory systems are still developing. Smog can irritate the eyes, nose, and throat of healthy young people. Anyone who works outdoors or who does a lot of exercise outdoors also faces a greater risk.
The health effects of smog are the same as those of its chemical components, ozone and fine particulate matter. Smog can trigger an asthma attack. Asthmatics have chronic airway and lung inflammation. Smog increases inflammation, leading to mucus secretion and narrowing of the airways. These two factors make breathing difficult. The actual cause of asthma is not known; anyone can get it, though it is usually diagnosed in children and teenagers.
Like smog, warm temperatures and humidity can also stress your body. When all three are combined, the likelihood of irritation and tissue damage increases.
Learning check
Why are there air quality monitoring stations located in rural areas, away from the big cities?
One reason is to inform people living in these areas. The second reason is because air pollution, though often created in larger cities, can travel to rural areas.
What is one reason that might account for the rural monitoring stations having readings as high or higher than some of the urban areas?
Air pollution can travel from big cities to rural areas.
People who are described as “high risk” for smog exposure check the AQHI regularly and plan their day according to levels of pollutants
a) What factors would make a person “high risk”?
Factors can include a history of heart and lung disease, or weakened and developing immune systems commonly found in seniors and children.
b) What activities should people—especially if they are “high risk”—avoid on days with a high AQHI reading?
Spend less time outdoors especially when exercising.
Smog advisories
When the AQHI reaches 10 or more, the overall air quality has deteriorated to an unhealthy level. That’s when the Ministry of the Environment issues a smog advisory.
The Ontario Ministry of the Environment has been issuing smog advisories since 1995. These advisories inform residents that high and long-lasting levels of smog and other air pollutants are expected. The advisories include suggestions about what activities should be avoided, both to protect personal health and to reduce the amount of locally produced smog. Most of these advisories are issued from May to October, especially on hot or unseasonably warm days. You can receive advanced notice of potential smog advisories via email by joining the Smog Alert Network through the Ministry of the Environment website.
The statistics below show the number of smog advisories issued in each year from 2008-2018 in Ontario.
| Year | Number of smog advisories |
|---|---|
| 2008 | 8 |
| 2009 | 3 |
| 2010 | 3 |
| 2011 | 5 |
| 2012 | 12 |
| 2013 | 1 |
| 2014 | 0 |
| 2015 | 0 |
| 2016 | 1 |
| 2017 | 0 |
| 2018 | 1 |
Table 1.1: Year and number of smog advisories
Data is often easier to understand if it has a strong visual component. A bar or a line graph (with data points connected) is a good way of presenting information visually. You have probably drawn and analyzed graphs before in Science and Math. Consider the model bar graph illustrating the number of smog advisories issued from 2008 to 2018.

Here’s a quick review of what to keep in mind when making a graph of your own.
Use most of the piece of graph paper.
Select the independent and dependent variables and label the axes accordingly; the x-axis is the independent variable (in this case, the year) and the y-axis is the dependent variable (in this case, the number of smog advisories).
For each axis, create a scale that is consistent and reasonable; divisions of 1, 2, 5, or 10 are easier to use than, say, 3 or 7.
Give your graph a title that describes the data fully and provide a legend if necessary.
Precautions
What precautions should you take on smog-advisory days? You certainly want to avoid harming yourself. Be sure to avoid or reduce the amount of exercise you do during the afternoon and during rush hours when smog levels are at their peak. Work out indoors if at all possible.
What are some other things you can do to reduce the danger of smog for yourself and others?
For example, leave your car at home and walk, ride your bike, or use public transit. If you have to cut your lawn, use a well-maintained push mower or an electric lawn mower instead of a gas- powered mower. Keep your car well maintained.
Consider this hypothetical data for Ontario. Note that there are two sets of data; Number of smog advisories and Total number of premature deaths attributed to air pollution.
| Year | Number of smog advisories | Total number of premature deaths attributed to air pollution |
|---|---|---|
| 2000 | 3 | 1,925 |
| 2001 | 7 | 2,705 |
| 2002 | 10 | 3,050 |
| 2003 | 7 | 2,735 |
| 2004 | 8 | 2,845 |
| 2005 | 15 | 5,829 |
| 2006 | 6 | 2,582 |
| 2007 | 13 | 3,495 |
| 2008 | 8 | 2,682 |
| 2009 | 3 | 1,900 |
Notebook
In your notebook, generate two graphs. One graph should indicate the number of premature deaths related to air pollution on a yearly basis from 2000 to 2009. The other graph should indicate the number of smog advisories on a yearly basis from 2000 to 2009
Learning check
Answer the following questions:
1. Why is it useful to have 2 sets of data?
Two data sets allow us to see if the number of premature deaths is correlated with the number of smog days per year.
2. What did you observe about the 2 sets of data?
As the number of smog advisories increased, so did the number of premature deaths attributed to air pollution.
3. What can you conclude from both graphs?
An increase in smog advisories correlates with an increase in premature deaths.
4. Why isn’t walking or biking the best thing to do on smog advisory days?
Walking or biking on smog advisory days should be avoided as these activities are considered aerobic activities, during which you may inhale more air and breathe more deeply into your lungs. This increases the chances of airborne particulates to enter your respiratory system, which could cause health problems to arise or exacerbate pre-existing condition.
Linking illness and the environment
Almost four million people in Canada are affected by asthma and 850,000 of those people are children under the age of 14. Approximately 25 million Americans suffer from the disease and a little over 8% of children in the United States have asthma. These numbers are rising yearly. Exposure to air pollution has been linked to delayed lung development in children. Studies have shown that living near a busy highway can reduce life expectancy by approximately two years. Exposure to fine particulate matter increases the closer people are too busy highways.
In 2015, research in Canada suggests that the number of premature deaths caused by air pollution was approximately 7,700 people a year.
Read the article, “Air pollution results in 7,700 premature deaths in Canada each year report says” for more information. (Opens in new window)
As you read, record new topics and questions you may have in your notebook.
But how do scientists reach these conclusions?
Researchers use data on death rates and weather patterns collected over many years, as well documented air-pollution information. Some of the premature deaths can be attributed to extreme weather conditions (heat or cold), but often it is observed that about 80% are linked to air pollution. Air pollution is a much greater risk because it is present throughout the year and can negatively affect a greater number of people.

In each learning activity, you will find a consolidation section. Here you will have an opportunity to reflect on both what you are learning and your growth as an independent learner.
Like you did at the beginning of this learning activity, take a moment to focus on your breathing…breathe in…breathe out….breathe in…breathe out. Think about how much more you know now about the air around you.
Notebook
In your notebook, recreate and complete the following table to reflect on what you used to think about air pollution and air quality and what you now know about this issue.
Air pollution
| I used to think... | But now I know... |
|---|---|
|
|
|
Self-check
Take a moment to self-assess your learning so far.
Make sure your notes are complete so that they can help you review for later assessments and tests. Take the time to review the concepts you are unsure of before moving on.
Conclusion
In this learning activity, you learned about contaminants in the air you breathe, their potential effects on your health, how government agencies monitor and inform the public of problems, and how epidemiologists determine if diseases are caused by environmental factors. Next, you’ll study another group of pollutants, heavy metals, which can affect the growth and development of your nervous system and brain.