
What can I do with a physics major?
Do you want to know the universe? Do you want to know the answers to some of the fundamental questions humans have been asking themselves for generations? Do you want to follow in the path of some of the most brilliant individuals the world has ever known? Do you want to learn the skills to answer the question "Why is our universe structured the way it is"? Physics is the key to understanding the smallest of atomic particles, the largest of galaxies, and all other phenomena in between.
As you prepare for university you may be considering taking physics as a major and wondering about the economic, societal, and career benefits of that choice. The following examples demonstrate some of the career paths you can take with physics.

For someone who completes a physics major, salary can vary widely. It all depends on your level of education and the nature of your specific job.
Complete the following activity by filling in the blank to describe the job depicted in the images. Can you guess how much you could earn in the following jobs? Be sure to check the results to find out.
Identify the career being described. If you happen to be incorrect, do some brief research about that career to understand what they do. Check the feedback for salary information.
Now that you can identify and describe some of the careers related to the field of physics, this course will help give you the baseline knowledge to be able to demonstrate scientific investigation skills (related to both inquiry and research) in four scientific investigation skills: initiating and planning, performing and recording, analyzing and interpreting, and communicating.
Let’s start with initiating and planning when it comes to setting you up for success in this course.
How does physics answer the question, "Are we there yet?"
According to the International Civil Aviation Organization, in 2019 the world’s airlines moved 4.5 billion people around the globe as well as 6.4 trillion dollars of goods. These are numbers our ancestors would have found astounding but we take for granted. We have come to expect to travel great distances with relative ease. At the start of the Industrial Revolution most of our ancestors would not have traveled more than 50 km from their homes in their lifetime.
Air travel involves piloting an aircraft from place to place without getting lost or endangering the safety of those on board or on the ground. Air travel differs from other forms of travel in several ways. Aircraft travel at relatively high speeds, leaving less time to calculate their position on route. Aircraft normally cannot stop in mid-air to ascertain their position.
An aircraft’s time in the air is limited by the amount of fuel it can carry; a surface vehicle can usually get lost, run out of fuel, then simply await rescue. There is no in-flight rescue for aircraft. Additionally, collisions with obstructions are usually fatal. Therefore, constant awareness of position is critical for aircraft pilots.
- What skills do they need?
- Where does physics play a role?
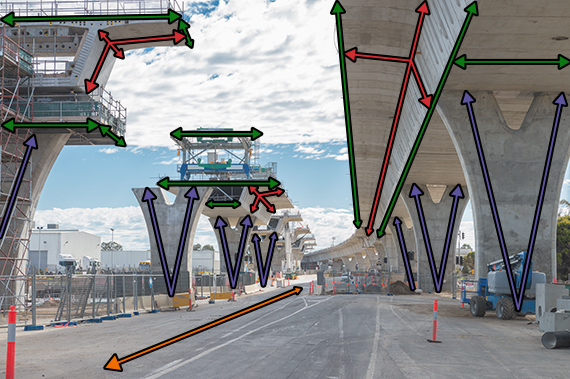
In this learning activity we will learn about one of the most powerful tools a pilot has, the understanding of vectors.
Explore This!
Examine the following video to help you understand the concept of relative motion. Consider the following questions, while viewing the video:
- Do we all observe the world in the same way?
- Are we moving the way we think we are moving?
- Does your physical description depend on what I am doing?
Some examples of vectors include various quantities such as the displacement, force, velocity, momentum, acceleration and many more. Knowing this, think about what everyday activities involve vectors?
You use vectors in almost every activity you do. A vector is a quantity that has a magnitude (size) and direction.
Examples of everyday activities that involve vectors include:
- Breathing → your diaphragm muscles exert a force that has a magnitude and direction.
- Walking → you walk at a velocity of around 6 km/h in the direction of the bathroom.
- Leaving for Lunch → the displacement from your office desk to the cafeteria is about 40 m in a northerly direction.
Each vector quantity has a magnitude and a direction. You may want to make a note of this in your notebook.
Notebook
Set up your notebook
While working through this course, you will need one other tool to help you stay organized. You will need a “notebook.”
This may be an actual pen and paper notebook where you can take notes and write reflections as instructed throughout the course. Alternatively, you may choose to have a digital “notebook” or a file where you type your notes and reflections. This is a personal decision, but it is important that you have a consistent place for your notes. Your notebook is only for your own reference, so keep it in a way that makes sense to you, and will continue to make sense as you progress through the course.
Be sure to add a title to each set of rough notes with the learning activity number and title. Spelling does not matter in these rough notes, but the act of completing these reflections and quick activities is important for your learning.
You will encounter questions throughout the course that ask you to pause and reflect on your learning, or to self-check. Record these questions and your answers in your notebook, then compare your response to the suggested answer if one is provided. Any differences are an opportunity to learn more, but as they are just suggestions they do not mean your answers are wrong. Think about your response, and ask a trusted friend or family member, search online, or contact your TVO ILC academic support team if needed.

Notebook
Consider each of the following terms. They may or may not be familiar to you. In your notebook, create a chart and record the definition, units of measurement, and examples of these concepts. Do your best, and refer back to your current ideas through the unit and course.
- waves
- frequency
- motion
- acceleration
- position
- velocity
Study of motion in physics
Mechanics is the branch of physics dealing with the study of motion. Motion is a fundamental idea in all of science. Its study has led to many developments in our understanding of physics. It is important to study mechanics to serve as a base for other, more advanced, concepts. As we continue our investigation into the physics of motion, avoid memorizing the information. Instead contemplate the information by thinking about its meaning and its applications. The hope is that you gain a comfortable foundation with the language that is used throughout the study of mechanics.
Scalars, vectors, distance, displacement, speed, velocity and acceleration — these words are used with regularity to describe the motion of objects.
Your goal should be to become very familiar with their meanings.
So, what is a vector and how are they used in everyday life?
A vector is a quantity that has both magnitude as well as direction. The term vector is used in mathematics, engineering, and most importantly physics. Unlike vectors, a scalar quantity is a value that is only described by its magnitude.
Notebook
Let’s check your understanding of this distinction. Using your notebook recreate the following table and consider the following quantities. Categorize each quantity as being either a vector or a scalar. Then press the show answers button to learn how you did.
| Quantity | Scalar or vector |
|---|---|
| a. 5 m | This is a scalar; there is no direction listed for it. |
| b. 30 m/sec, East | This is a vector; a direction is listed for it. |
| c. 5km, North | This is a vector; a direction is listed for it. |
| d. 20 degrees Celsius | This is a scalar; there is no direction listed for it. |
| e. 256 bytes | This is a scalar; there is no direction listed for it. |
In your studies of physics your ability to represent physical concepts in a visual manner becomes very important. The world that we study in physics is a physical world - a world that we can explore.
Therefore, our ability to visualize and create visual representations in the study of physics helps solidify concepts into a deeper understanding.
Begin cultivating your visualization skills early in this course. Let’s focus on the use of diagrams to describe the motion of objects.
Definition
Vector diagrams are diagrams that depict the direction and relative magnitude of a vector quantity by a vector arrow. Vector diagrams can be used to describe the velocity of a moving object during its motion.
For example, a vector diagram could be used to represent the motion of a car moving down the road.


Scalar quantities versus vector quantities
Measurements can be classified into one of two categories: scalar measurements and vector measurements.
Both scalar and vector quantities are used at different times in describing and measuring motion.
Definition
Scalar quantities: consist of a number (the magnitude), and appropriate units.
Scalar measurements, such as time, mass, speed, and distance have numerical values and a unit of measurement. For example:
- time s
- speed v 80 m/s
- distance
- mass m 10 kg
Definition
A vector is a number (the magnitude), appropriate units, and a direction.
Vector quantities, such as displacement, velocity, and acceleration, include numerical values, a unit of measurement and a direction. For example:
- displacement [east]
- velocity = [south]
- acceleration [down]
Notice whenever you specify a vector quantity using a value and a direction, you add the vector symbol (arrow) above the variable.
Vectors in two dimensions
Notebook
Consider the following velocities:
[forward],
Note that, for the purposes of this course, forward will mean that the vector is horizontal and points towards the right. In other words, this vector is pointing towards the east directionally.
[south] (This can also be written as 65 km/h [S].)
[west 25° north]
[south 10° east]
Using your notebook, copy the four different velocities given and answer the following questions:
What do these four velocities have in common?
What are the differences in the way they are written?
All the velocities have a size, units, and a direction; however, these characteristics are different for each value.
For example, if we closely examine the first two vectors, and , we observe that we only need one direction component to describe them (one-dimensional vectors). As shown in the following diagram is 2.4 m/s towards east and is 65 km/h towards south.


The last two vectors, and , need two direction components and an angle to clearly define them (two-dimensional vectors). These velocities can be represented with vectors drawn to scale, as shown in the following diagrams.


Describing vectors
A vector is represented as an arrow, with a “head” or “tip” and a “tail,” as shown in the following diagram. The arrowhead shows the vector’s direction.

Representing a vector graphically and numerically
For example, consider this displacement vector represented graphically beside a reference point. In this course the reference point is often at the center of a 4-point compass rose indicating north, south, east, and west.

This displacement vector may be shown graphically, or may be written numerically as:
8 m [E] or 8 m [east].
All vectors have a direction but not all vectors point directly north, south, east or west, so…
How would you communicate a vector’s direction?
There are several acceptable ways to communicate a vector’s direction in two-dimensions.
In the following diagram, a vector points 50° east of north. In other words, the direction of the vector would start north then rotate 50° towards the east.

Instead of drawing the vector, you can also state the vector using written notation.
In this example, you would state [N50°E]. The brackets show that it is vector notation. The example used north, east, south and west as labels for direction of the vector but other direction labels are also acceptable.
Let's examine the following two examples:
Example 1
A velocity of 80 km/h [NW] or [N45°W]. As shown in the following diagram.
![velocity of 80 km/h [NW]](../assets/img/sph4u_01.01.60.svg)
Example 2
An acceleration of 5 m/s² [S25°E] or [E65°S]. As represented in the following diagram.
![acceleration of 5 metres per second squared [S25°E]](../assets/img/sph4u_01.01.12.svg)
Notebook
This is self-check list, suggested as guidance for your understanding of the concepts in this learning activity.
- assess and evaluate your own work
- determine where you are in your learning, where you need to go, and how best to get there
You will be provided with suggested answers to compare to your own responses throughout the learning activities.
After checking your responses, ask yourself the following reflection questions and answer them in your notebook:
- What did I do well?
- What concepts do I need to review?
- What are my next steps to ensure I understand all the concepts?
Examples
State the direction of each of the following three vectors diagrams shown.
Vector 1:

[SW] or [S45°W] or [W45°S]
Vector 2:

[E 25° N] or [N 65° E]
Vector 3:

[N 15° W] or [W 75° N]
Notebook
In a vector diagram, the magnitude of a vector quantity is represented by the size of the vector arrow. If the size of the arrow in each consecutive frame of the vector diagram is the same, then the magnitude of that vector is constant. For this and the next series of questions, copy the question and your answer into your notebook for future reference, then check your response with the suggested answer.
Review each vector diagram on the left. Identify the direction of the vector depicted and record your answer in the second column.
| Vector diagram | Direction |
|---|---|
1.  |
[W 50° S] |
2. 
|
[E 8° N] |
3.  |
[S 50° W] |
4.  |
[N 8° E] |
Try it!
For the next series of multiple-choice questions, study each of the following vector diagrams shown and choose the correct direction to check your understanding.
Drawing vectors
There are situations in which it is useful to draw scale diagrams of vectors. When you do this, always include a scale statement such as:
“Let 1 cm = 2 m”
To communicate the size of the vector being drawn. For example, to draw a vector that is 10 m long, you may draw a vector that is 5 cm long on your paper and include a statement that “1 cm = 2 m.”
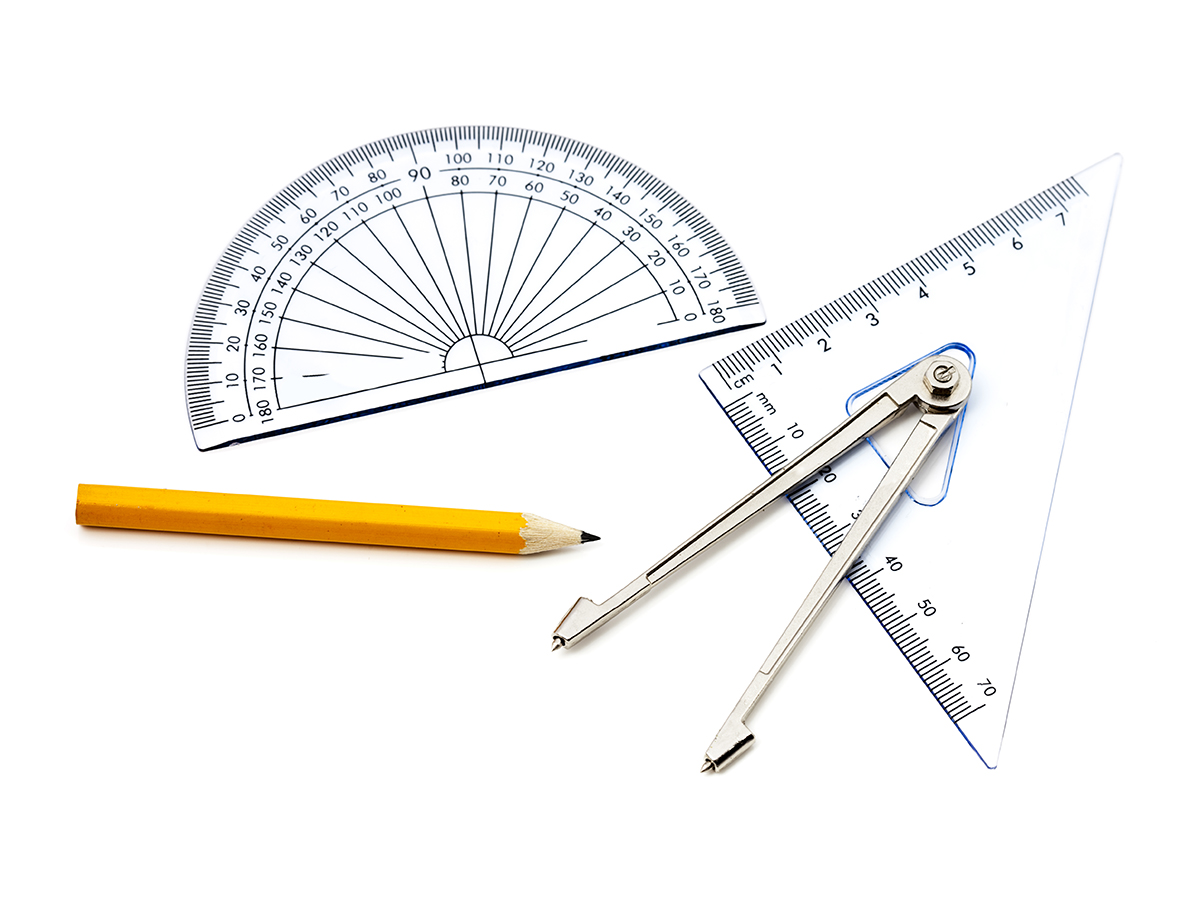
It is suggested that you use a ruler, a protractor, and a compass when drawing these types of diagrams as they need to be created to scale.
Examples
The following examples will guide you through determining an appropriate scale and help to clarify the concepts involved in drawing vectors.
Consider the following velocity vectors that were mentioned previously:
- = 2.4 m/s [forward]
- = 65 km/h [south] (This can also be written as 65 km/h [S].)
- = 14 cm/s [west 25° north]
- = 7.5 m/min [south 10° east]
Note that, for the purposes of this course, forward will usually mean that the vector is horizontal and points towards the right.
First, choose a scale that is easy to draw. To find the length of line you need to draw, take the original measurement and divide by the scale.
For example: 1 cm = 20 km/h that could be expressed as [1 cm : 20 km/h].
Then use this factor to convert the original measurement of 65 km/h [south] to the scaled measurement.
1 cm/ 20 km/h × 65 km/h = 3.25 cm
Now, use the scale and direction to create the given velocities represented with vectors ( and ) drawn to scale, as shown in the following diagrams.


In a similar fashion, use the scale and direction to create the given velocities represented with vectors ( and ) drawn to scale, as shown in the following diagrams.

![Vector 4 is 7.5 m/min [S 10o E] being represented on a scale of 1 cm = 2.5 m/min.](../assets/img/sph4u_01.01.18d.svg)
To draw vectors that do not lie exactly along a compass direction (N, S, E, or W), it is necessary to work from a reference point with its own compass directions.
Notebook
In your notebook, follow the directions for making vector drawings. Press each tab to learn how to draw vectors when the direction includes an angle.

Example: If the angle is [east 30° north] start on the east line and move 30° north.

Example: If the vector is 200 km, choose a scale of 1 cm = 100 km. The length of the line should be 2 cm.
Draw the vector along the angle to the correct length (measured using the scale).

Try it!
For each of the following questions, state the direction of the vector shown using the indicated angle. Press submit to check your understanding.
Vector addition
So far, we’ve discovered that vectors consist of two parts, magnitude and direction. Breaking down a vector into horizontal and vertical components is a very useful technique in understanding physics problems.
Whenever you notice motion at an angle, you should perceive it as moving horizontally and vertically at the same time. Simplifying vectors in this way can speed calculations and help to keep track of the motion of objects.
Components of a vector
The horizontal component stretches from the start of the vector to its farthest x-coordinate. The vertical component stretches from the x-axis to the most vertical point on the vector. Together, the two components and the vector form a right triangle as shown in the following diagram.

Explore this!
The following video explores the differences between scalar and vector quantities. It also uses a demonstration to illustrate the importance of vectors and vector addition which starts at 4:46 second mark of the video.
Definition
Coordinates: Numbers indicating a position with respect to some axis. For example: x and y coordinates indicate position relative to x and y axes.
Axis: An imaginary line around which an object spins or is arranged.
Magnitude: A number assigned to a vector indicating its length.
By taking the vector to be analyzed as the hypotenuse, the horizontal and vertical components can be found by completing a right triangle. The bottom edge of the triangle is the horizontal component and the side opposite the angle is the vertical component.
Review
Before we can really dive into the addition of vectors, let’s refresh our math skills. Can you describe the following terms and expressions?
right-angle triangle
a² + b² = c²
cosine
hypotenuse
sine
tangent
Explore this!
Review of the Pythagorean theorem and trigonometry
The following video links have been provided as suggestions only. You are encouraged to search for additional resources to support your understanding.
Examine the following video to review the mathematical concepts of the Pythagorean theorem and right-angle trigonometry before continuing with this section.
The following video explores additional examples to review trigonometry.
Adding and subtracting vectors
Definition
Resultant: The resultant is the vector obtained by adding or subtracting other vectors.
When it comes to adding (and subtracting) vectors there are three methods.
- Method 1: Using a scale diagram
- Method 2: Using algebra — trigonometry (sine and cosine law)
- Method 3: Using perpendicular components
Although in this unit you are learning about vectors of motion (e.g. displacement, velocity, and acceleration), you will also be applying vector concepts throughout this course. Knowing how to draw and represent a vector in physics is an essential skill for this course. Let's examine how we apply this skill next.
Method 1: Vector addition using scale diagrams
When adding vectors, you will be drawing the first vector and then placing the “tail” of the next vector against the “head” or “tip” of the first vector drawn. This is called the “tail-to-tip” or “tip-to-tail” method.
The resultant vector is found by connecting the “tail” of the first vector to the “head” or “tip” of the last vector. In other words, if you are finding the resultant displacement by adding two displacement vectors, you would be connecting the “Start” position to the “Finish” position with a vector.
Explore this!
Still not sure how to use this first method? Explore the following video which outlines how this method can be used.
Example 1
Ryan (he/him) is walking through the school library to meet his group to discuss the physics project on dynamics.
Find the displacement for Ryan when he travels 14 m [N] and then 25 m [S].
Solution
Using a vector diagram, draw both displacement vectors, plus the resultant.
and

The tail of vector 2 was placed alongside the head of vector 1. The resultant (or total) displacement is found by connecting the “Start” position to the “Finish” position with a vector. The vectors must be drawn with arrowheads to indicate their direction.
But what happens when vectors are not aligned in one dimension?
Example 2
Felicia (she/her) is on her way to meet Ryan, however she’s on the other side of the school campus. She travelled 25 m [east] and then 30 m [north]. Find Felicia's displacement.
Construct a diagram:
You can’t use simple arithmetic to do this, as these directions can’t be aligned in one dimension.
First construct a diagram like the one shown, and then decide how to find the displacement.

Displacement:
Drawing a resultant (a vector drawn from “Start” to “Finish”) creates a triangle. The resultant vector is equal to the displacement.
Measure the length of this vector to determine the size of the displacement.
If you measure the vector, you will find it is 3.9 cm long.
Using the scale of 1 cm = 10 m,
.
Felicia’s displacement is 39 m.

Direction:
Displacement is a vector and needs a direction as well as a magnitude. To find the direction, use a protractor to measure the angle where the tails of the vectors meet.
Direction is always measured at the start of the resultant, never at the end.
That angle is approximately 50° from the east towards the north. So, the final answer for Felicia’s displacement is 39 m [east 50° north].
Try it!
Let's review the concepts we've covered so far before we explore methods 2 and 3.
There is a certain order to drawing a scale diagram when solving for displacement. What is the correct order?
Using the dropdown menus, put the steps in the correct order for finding the displacement then press submit to check your understanding.
Notebook
Ready for another one?
You will be required to draw a vector diagram, it is suggested that you use a ruler and a protractor, to solve this problem in your notebook. Compare your work with the suggested answers to check your understanding.

A truckload of computers travels across northern Ontario 45 km [west] and then 65 km [south].
Find the truck’s displacement.
79 km [west 55° south]
Compare your drawing to the following:

If you chose a scale of 1 cm = 10 km, when you measure the displacement vector you should find it is about 7.9 cm long. When you measure the angle θ you should find it to be about 55° from the west towards the south.
Drawing the scale diagram can sometimes give you an answer slightly different from the correct answer because it is hard to measure everything exactly.
A more exact method for finding the answer uses algebra instead of scale diagrams. Next, we will explore using algebra to add vectors.
Method 2: Vector addition using algebra
You may want to review the basic concepts of trigonometry that you need to best understand this learning activity.
Let’s go back to the first few examples from this topic. But this time we’ll solve it using algebra techniques instead of scale diagrams. The answers should be the same.
Example 1
Let’s use the example of Ryan (he/him) walking through the school library to meet his group to discuss the physics project on dynamics. Find the displacement for Ryan when he travels 14 m [N] and then 25 m [S]. Use vector addition using algebra (Method 2) to solve the problem.
Solution: Vector addition using algebra.
Using algebra, and
Note: Vectors need to have the same direction in order to add them algebraically.
Ryan’s displacement is 11 m south.
Example 2
Let’s continue using the example of Felicia (she/her) on her way to meet Ryan; however she’s on the other side of the school campus. She travelled 25 m [east] and then 30.0 m [north]. Find Felicia's displacement using vector addition using algebra (Method 2).
Solution: Vector addition using algebra.
You still need to draw a diagram, but it can just be a quick sketch instead of a measured scale diagram as shown in the following diagram.

Use the Pythagorean theorem to find the magnitude of the resultant displacement, . Remember is the hypotenuse (side c) and the other two sides are a and b.
Use trigonometry to find the angle. 30 m is the opposite side and 25 m is the adjacent side.
To give the final answer, put the magnitude of the displacement and angle together:
Felicia’s displacement is 39 m [east 50° north]. Check back to the answer you got using scale diagrams and you should notice that the answers are similar.
Think
Do you think regardless of the method we use will we get the same answer?
Let’s revisit the example of the truckload of computers that travels 45 km [west] and then 65 km [south] across Northern Ontario. Find the truck's displacement.

Step 1: Find the hypotenuse

Use the Pythagorean theorem to find .
The is the hypotenuse (side c) and the other two sides are a and b.
Step 2: Find the angle
Use trigonometry to find the angle. 65 km is the opposite side and 45 km is the adjacent side.
Step 3: Put the magnitude of the displacement and angle together
To give the final answer, put the magnitude of the displacement and angle together:
The truck’s displacement is 79 km [west 55° south].
Check back to the answer you got when you used scale diagrams (Method 1) and you should notice that the answers are similar.
Take a break!
Excellent work! You have just completed the section on representation and drawing of vectors. Now is a great time to take a break before you continue with methods in vector addition.
Vector addition (Non-right triangle)
So far we’ve been able to add vectors that make up a right-angled triangle. But how would you add vectors when they don’t make a right-angle triangle?
In the next example, you will learn to add vectors when you don’t have a right angle.
Example
A Toronto streetcar is traveling across the city. Find the displacement of a streetcar that travels 80.0 km [N] and then 1.0 × 10² km [W20°N].
A scale diagram is nice, but the most accurate way to solve a problem is using math. Let's use the two mathematical approaches to solve the problem: trigonometry, then perpendicular components.

Method 1: Using trigonometry (sine and cosine law)
Algebraically, when adding vectors that are not perpendicular, you can use the sine and cosine law to solve for the resultant vector. Before we try to solve the problem with this method, let’s review the formulas we will be using.
Formula
Cosine Law: where C is the angle across from side c.
Sine Law:
Explore this!
The following video gives a detailed review of sine and cosine law.
Note regarding your calculator's degree mode
This course uses degrees for angle measurements. Ensure that your calculator is set to degree mode. Refer to your calculator's manual for instructions to change the setting. You can verify the setting by noticing the letter "D" or "DEG" on your calculator display.
We can use the sine and cosine laws to solve this problem.
Find the displacement of the Toronto streetcar that travels 80.0 km [N] and then 1.0 × 10² km [W 20° N].
Press on the steps to view the full solution.

The two individual movement vectors are arranged tip-to-tail from a starting point in the bottom right corner. The displacement (resultant) vector is then added, from the tail of the first vector to the tip of the second vector. We label it . We can also mark the resultant's direction angle, θ (the Greek letter theta, commonly used in physics to represent unknown angles. We know the angle between the two vectors within the triangle is 110°, since the second vector is 20° north of west, and there is a 90° between west and south.
Therefore, the displacement of the streetcar is 148 km [N 39° W].
Method 2: Using perpendicular components
You explored solving vector problems using scale diagrams and trigonometry. The third method of adding two or more vectors is based on resolving or breaking up a vector into perpendicular components.
This is a very common procedure – let’s review this method closely to make sure you understand how it works.
Any vector may be represented in two dimensions as having parts of the vector that lie along the x-axis and the y-axis.
For example, a displacement vector of 5.0 m [N45°E] will have a component that is parallel to the x-axis and a component that is parallel to the y-axis. Those components are perpendicular to each other as shown in the following diagram.
![Displacement vector indicating a displacement of 5.0 m [N45E]](../assets/img/sph4u_01.01.43.svg)
Note that the magnitude of a vector can be expressed either with vertical bars around the vector, or by writing the vector's name without an arrow on top. So is the magnitude of vector , and so is . To resolve the vector into the perpendicular components, you will use the following trigonometric ratios. Press each tab to explore the component.
Now to add vectors in two-dimensions, you will resolve (or break up) all the vectors into their perpendicular components, and then add all the parallel components.
Once this is done, the Pythagorean theorem and the tangent ratio may be used to determine the magnitude of the resultant vector and its direction (angle).
Now we will solve the same example of streetcar as before but the component method will be used:
Find the displacement of a streetcar that travels 80.0 km [N] and then 1.0 × 10² km [W20°N]. Press each tab to explore the solution.
Start by defining which directions are positive. Typically, north and east (up and right on a diagram) will be treated as positive, but we always have the option to change that. [North] and [East] are the positive directions.
For this example, the following diagram includes the perpendicular components.

Vector is already vertical, so it has just one component: 80 km [N]. Vector has a vertical and a horizontal component: 34.2 km [N] and 94 km [W]. In the previous step, we defined [East] as a positive direction, so we will have to be mindful of that [West] in the next step.
You can explore how the components in the previous diagram were obtained:
Now that we have the individual components, we can find the components of the resultant by just adding (or subtracting) parallel components.
Use Pythagorean theorem and tangent ratio to determine the magnitude of the resultant vector and its direction (angle).
Therefore, the displacement of the streetcar is 148 km [N39°W].
Notice how the answer is the same as the previous method’s answer.
If you are adding more than 2 vectors together, follow the same steps but once you have drawn the second vector, draw a new set of coordinates at the head of the second vector and draw the third vector from there.
The resultant is still drawn from the start of the first vector to the end of the last vector.
Explore this!
The following video is on how to draw the addition of 3 vectors, using a method called head to tail addition method.
Mathematical communication
In this course, you will use a word processor to prepare and submit your assignments for grades. Part of that work requires you to use an equation editor to produce professionally-formatted mathematical expressions. Refer to the "Start Here - Welcome to SPH4U!" section of the course for more information.
Diagrams can be created using computer software, or you can draw them on paper. If you draw them, take a clear, well-lit photo. Images, either digitally created or from a photo, can be inserted into your word processing software.
You may need to search online for support in creating your desired expressions using the editor of your choice. In Microsoft Word, hold alt and press the equal button on your keyboard. In Google Docs, open the Insert menu and select "Equation" (this also works in Microsoft Word, if you prefer).
To get you started, here are some useful shortcuts that can be used in Google Docs and Microsoft Word's equation editors. To create a subscript, as in , use the underscore key. To produce that expression, you would type "d_1", followed by a space. The square root symbol can be inserted using the \sqrt shortcut.
In Microsoft Word's equation editor, you can format a vector by typing "(d_x)\vec" followed by two spaces. The first turns the "\vec" into an arrow, the second correctly places it on top of the letters. For a single letter name, you may choose to omit the parentheses. "v\vec", followed by two spaces.
In Google Docs equations, you would first type the "\vec" shortcut, then a space, then type your vector's name. Press the right arrow on your keyboard to exit the vector formatting.
Significant digits
The study of physics involves the science of measurement. Throughout this course, you will be exposed to numbers that represent real-life measurements. You just encountered a few of those: 80.0 km [N], 1.0×10² km [W20°N], 45 km [west], and some others. When performing calculations on those numbers to get an answer, it's vital to communicate how accurate they are. There is an important distinction between, for example, saying your robot can lift up to 14,000.00 kg, and saying it can lift up to 14,000 kg. The first number communicates a high degree of accuracy. That engineer is certain the robot can lift 13,999.99 kg, but it can't lift 14,000.01 kg. While it's possible they've calculated the capacity to that degree of accuracy, it's not very likely. The second engineer is communicating a limit of around 14,000 kg. We wouldn't be surprised if it could safely lift 14,200 kg, but we wouldn't be disappointed if it broke when trying to lift that amount either.
In science, accuracy in measurements is communicated through significant digits. Significant digits are a simplified form of mathematical analysis that describes how precisely a value is known.
Determining significant digits
Significant digits are the meaningful digits in a measured or calculated quantity. We use the following rules to count the significant digits in a number.
- Any digit that is not zero is significant.
- 754 cm has three significant digits: 7, 5, and 4.
- 1.2345 kg has five significant digits.
- Zeroes between significant digits are significant.
- 901 m has three significant digits.
- 1.803 m/s has four significant digits.
- Leading zeroes, those to the left of the first nonzero digit, are not significant.
- 0.000000905 has three significant digits. The zeroes at the start are not significant.
- 0.5 has one significant digit. The leading zero is not significant.
- Trailing zeroes, those to the right of the last nonzero digit, are only significant if there are some digits to the right of a decimal point.
- 0.0900 has three significant digits (900). There are zeroes to the right of the decimal, so the trailing zeroes are significant.
- 25,000 has two significant digits (25). There are no digits to the right of the decimal, so the trailing zeroes are not significant.
- 34,000.00 has seven significant digits. There are digits to the right of the decimal, so all trailing zeroes are significant.
- Exact values, like a number of repetitions, quantity of electrons, etc. have an infinite number of significant digits.
Significant digits and math
When performing a mathematical operation, communicate the final result using the lowest number of significant digits of all inputs. For example, 5.0+3.000105, when entered in a calculator, gives a result of 8.000105. If that were the final answer of a mathematical calculation, we would record the final value with two significant digits: the smaller of 2 and 7. Therefore, the sum of the two numbers is 8.0.
Note that this rule applies only to communicating the final result. You should keep as many digits as possible in your scientific calculator. When recording results in the middle of a longer solution, ensure you record at least two or three extra significant digits (and still keep as many as possible in your calculator). Then, in your final statement, round to the appropriate number of significant figures.
As previously mentioned, significant digits are a simplified way to express precision. There is a whole field of science that analyses precision and accuracy in equations. You may have the opportunity to learn more about that in future courses you take. For our course, follow the rules of significant digits in your submitted work.
Notebook
Let's make sure you are comfortable using all of the equations taught in this learning activity. For this practice section it is suggested that you use a notebook, a ruler and protractor. Compare your work with the suggested answers to check your understanding. For the purposes of significant digits, you can assume that all angles provided in this course are exact.
- A person drives 8.0 km [N], and then 6.0 km [W]. Find the total displacement.
- A person travels 2.0 m [E 20° S], then 4.0 m [S]. Find the total displacement.
- A truck drives 1.0 × km [S], turns and drives 80.0 km [W 30° S], then turns again and drives 20.0 km [N]. Find the total displacement.
- Resolve the following vectors into their components.
- 17 m/s [N]
- 40 m/s [S 45° E]
- Resolve this vector into its components. 25 m/s [E]
- Resolve this vector into its components. 95 m/s [N 20° W]
You can review additional example within the following document Vector Addition Using Components(Opens in new window) to learn about adding vectors using components.
Review the suggested answers to these problems(Opens in new window)
Compare your responses to the suggested answers. Did you get the same final answer, including significant digits? Did you use the same method, or a different one? Suggested answers are just that - suggestions. If your response is different, think carefully about the choices that were made, then reflect on whether your solution is accurate as well.
Notebook
Part 1 — Summarize your learning
You have reviewed a lot about vectors and have applied them to a variety of new scenarios. You will continue to work with vectors as we learn more about motion in this course.
You can only add two vectors if their units and directions match. What must you do if the directions are:
-
Collinear (i.e. sharing the same line), but opposite in direction?
If two vectors are collinear, but opposite in direction, you must make their directions the same. This is done converting one of the vectors to the negative magnitude (scalar value) with same direction as the other vector.
For example:
If vector # 1 had a direction of [E] and vector # 2 had a direction of [W], then direction of vector #1 could converted from [E] to –[W].
(The negative value of direction is equal to the positive value of a direction 180° from its original heading.)
-
Non-collinear (i.e. do not have their directions along the same line)?
If the two vectors are non-collinear, you must add them, head-to-tail, and draw the resultant vector (starting from the tail of the first vector and ending at the head of the last vector). Then, you must decide how to solve the problem mathematically.
If the diagram results in a right-angled triangle, you can use the Pythagorean theorem and trigonometry functions to find the magnitude and direction of the vector.
If the triangle is not a right-angled triangle, you can
- Break each vector into its x- and y-components.
- Add the x-components together.
- Add the y-components together.
- Add the resultant x- and y-components to get a right-angled triangle that shows the resultant vector.
- Then use the Pythagorean theorem to find the magnitude of the resultant vector.
- To find the angle, you can use the inverse tangent function.
or
You can create the triangle formed by the vectors and use a combination of cosine and sine laws. You may need to use some geometry to bring the angle back into a standard reference frame (N,S,E,W).
Recreate the following table into your notebook. To help you fuse your understanding of vectors, complete your vector chart. Compare your work with the suggested answers to check your understanding.
| Definition: Vector | Characteristics: |
|---|---|
| A vector quantity consist of a number, appropriate units and a direction. | Requires the use of geometry to solve problems with vectors. |
| Examples: | Non-examples (aka scalars): |
|
|
Part 2 — Summarize your learning: Concept mapping
A concept map is a type of graphic organizer. It starts with a main idea or concept and branches out with sub-topics and related concept terms. Start with a main idea, topic, or issue to focus on, then determine the key concepts that are related to the main idea or concept.
Find the key concepts that relate directly to the main topic. In this way, concept mapping is a hierarchical type of graphic organizer where some parts rank with higher priority than the other topics/concepts. Find the other concepts that relate to those key concepts and keep branching out as necessary.
The unique feature of concept mapping is the connecting of concepts/terms with linking phrases and words. This sets apart a concept map from a mind map. Links may be made between two concepts, and cross-links may be made when a connection is made to a different area of the map. This connecting of concepts is important in understanding complex topics.
How do you create a concept map?
Use a concept map to organize terms based on their relationships with each other after each learning activity. At the end of each unit, you will combine them to provide a comprehensive graphic organizer that summarizes the key concepts of the unit.
The following is an example of concept map.

Notebook
In the introduction to this course, there were ideas about building concept maps. Choose how you would like to create your concept maps and start by creating your first map now. Save it to use it again at the end of the unit.
You will use a concept map to organize the following terms based on their relationships with each other.
Terms to include in your concept map: (may be used more than once)
- motion
- vectors
- scalars
- uniform motion
- non-uniform motion
- magnitude
- direction
- distance
- components
- vector addition
- vector subtraction
- geometry
- scale diagram
Part 3 — Reflect on your learning
To check your understanding, reflecting on what you learned in this learning activity will be helpful.
You have learned about three different methods of vector addition. You can use your notebook to complete each of the following questions.
Each method has its advantages and disadvantages. Using what you have learned and experienced while using the various methods, in your notebook replicate and complete the following T-charts for each method.
| Method 1: Scale diagram | |
|---|---|
| Advantage | Disadvantage |
| Method 2: Trigonometry | |
|---|---|
| Advantage | Disadvantage |
| Method 3: Perpendicular components: | |
|---|---|
| Advantage | Disadvantage |
Try it!
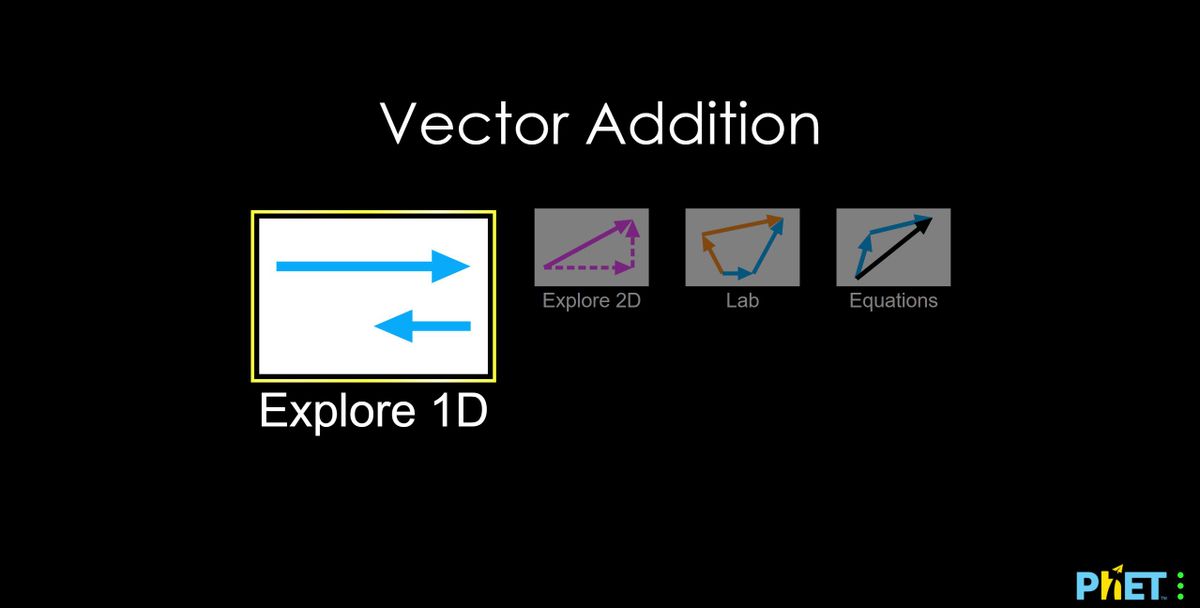
Practice the concepts just learned in this learning activity by using the following simulation.
Launch the following simulator – apply and reinforce all of your knowledge of vectors:
Self-check quiz
Check your understanding!
Complete the following self-check quiz to determine where you are in your learning and what areas you need to focus on.
This quiz is for feedback only, not part of your grade. You have unlimited attempts on this quiz. Take your time, do your best work, and reflect on any feedback provided.
Connecting to transferable skills
Ontario worked with other provinces in Canada to outline a set of competencies that are requirements to thrive. Ontario then developed its transferable skills framework as a set of skills for students to develop over time. These competencies are ones that are important to have in order to be successful in today’s world.
Read the following document entitled Transferable Skills Outline (Opens in new window) to explore the framework and the descriptors for each skill. Download, print, or copy the information in the document into your notes - you'll refer to it in each unit.
Press the following tabs to explore the skills.
Note the indicators that you think you will develop in this course. Throughout this course, you should revisit these skills to reflect on which ones you develop and if your original predictions were correct.
As you continue through this unit and the rest of the course, keep your notebook updated and be mindful of opportunities to apply and develop transferable skills.